
June 2018 Paper 3 Q12
12 The histogram below shows the heights, in cm, of male A-level students at a particular school.
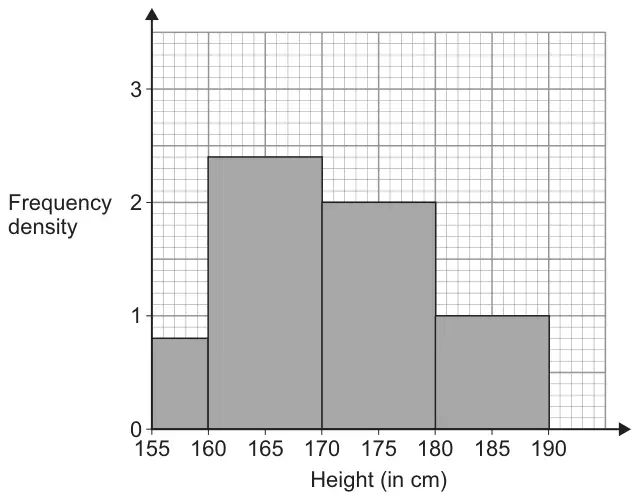
Which class interval contains the median height?
Circle your answer. [1 mark]
- \([155, 160)\)
- \([160, 170)\)
- \([170, 180)\)
- \([180, 190]\)
| Scheme | Marks | AO |
|---|---|---|
| Circles correct answer | B1 | AO1.1b |
| (1 mark) |
Typical solution
170 - 180