June 2018 Paper 2 Q3
3 The graph of \(y = x^3\) is shown.
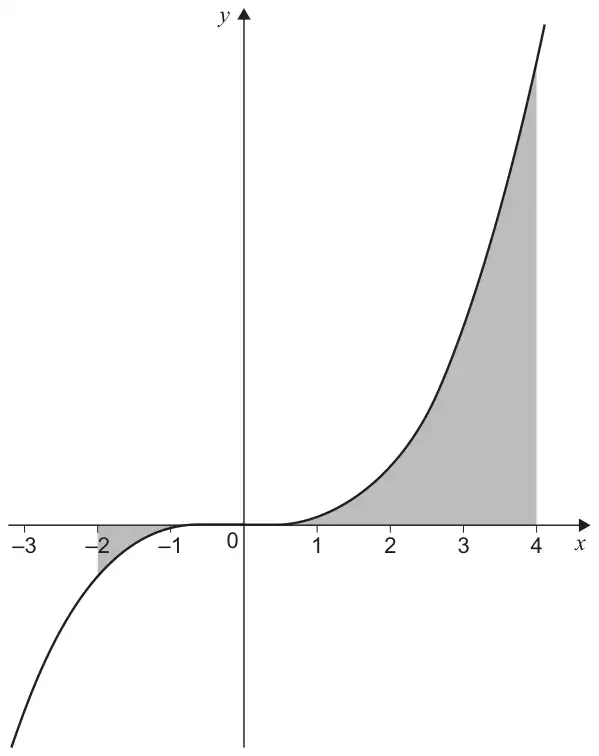
Find the total shaded area.
Circle your answer. [1 mark]
- \(-68\)
- \(60\)
- \(68\)
- \(128\)
| Scheme | Marks | AO |
|---|---|---|
| Circles correct answer | B1 | AO1.1b |
| (1 mark) |
Typical solution
68

Understand it. Practise it. Enjoy it. All for free.
3 The graph of \(y = x^3\) is shown.
Find the total shaded area.
Circle your answer. [1 mark]
| Scheme | Marks | AO |
|---|---|---|
| Circles correct answer | B1 | AO1.1b |
| (1 mark) |
68