
October 2020 Paper 2 Q9
9 The histogram shows information about the numbers of cars in five different price ranges, sold in one year at a car showroom.
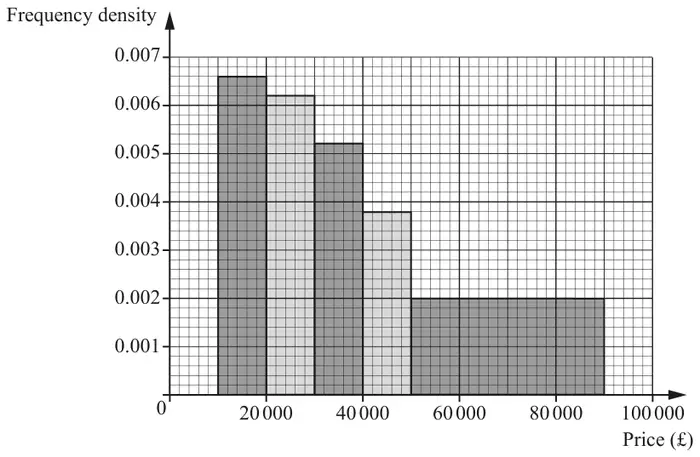
It is given that 66 cars in the price range £10 000 to £20 000 were sold.
(a) Find the number of cars sold in the price range £50 000 to £90 000. [1]
(b) State the units of the frequency density. [1]
(c) Suggest one change that the management could make to the diagram so that it would provide more information. [1]
(d) Estimate the number of cars sold in the price range £50 000 to £60 000. [1]
| Scheme | Marks | AO |
|---|---|---|
| \((40000 \times 0.002 =)\ 80\) | B1 | 1.1 |
| [1] |
| Scheme | Marks | AO |
|---|---|---|
| Frequency per £ or No. of cars per £ | B1 | 1.1 |
| [1] |
Notes
Allow cars / £ Allow as fraction
NOT cars / price NOT cars / money
| Scheme | Marks | AO |
|---|---|---|
| Show fds for four separate classes within £50000 - £90000 | B1 | 2.3 |
| [1] |
Notes
Make price intervals smaller
Show the median (or similar)
Include more bars
Give a title
Explain \(y\)-axis better or give units of f.d.
Give the frequencies
| Scheme | Marks | AO |
|---|---|---|
| 20 | B1f | 1.1 |
| [1] |
Notes
or (a) \(\div\) 4