
June 2022 Paper 3 Q5
5. A company has 1825 employees.
The employees are classified as professional, skilled or elementary.
The following table shows
- the number of employees in each classification
- the two areas, \(A\) or \(B\), where the employees live
| \(A\) | \(B\) | |
|---|---|---|
| Professional | 740 | 380 |
| Skilled | 275 | 90 |
| Elementary | 260 | 80 |
An employee is chosen at random.
Find the probability that this employee
Some classifications of employees are more likely to work from home.
- 65% of professional employees in both area \(A\) and area \(B\) work from home
- 40% of skilled employees in both area \(A\) and area \(B\) work from home
- 5% of elementary employees in both area \(A\) and area \(B\) work from home
- Event \(F\) is that the employee is a professional
- Event \(H\) is that the employee works from home
- Event \(R\) is that the employee is from area \(A\)
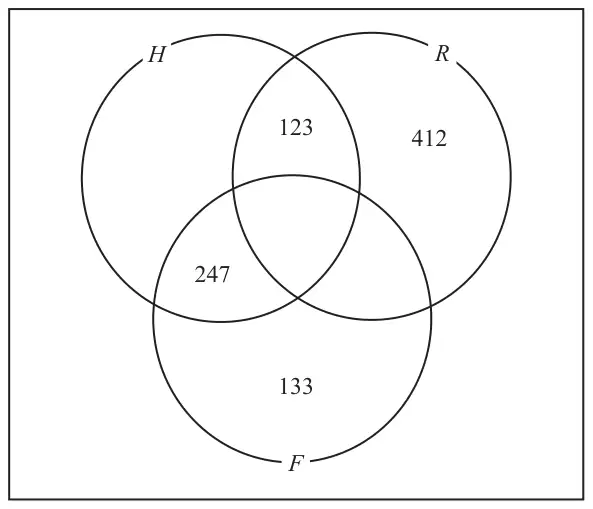
| Scheme | Marks | AO |
|---|---|---|
| \(\dfrac{365}{1825}\) or \(\dfrac{1}{5}\) or 0.2 oe | B1 | 1.1b |
| (1) |
Notes
Look out for answers given in the question. If you see answers in the question and in the answer space those in the answer space take precedence.
B1: Allow equivalent
| Scheme | Marks | AO |
|---|---|---|
| \(\dfrac{170}{1825}\) or \(\dfrac{34}{365}\) or awrt 0.093 | B1 | 1.1b |
| (1) |
Notes
B1: Allow equivalent
| Scheme | Marks | AO |
|---|---|---|
| \(90 \times 0.4 + 80 \times 0.05\,[= 40]\) or \(90 \times 0.6 + 80 \times 0.95\,[= 130]\) or \(740 \times 0.65\,[= 481]\) or \(740 \times 0.35\,[= 259]\) | M1 | 3.1b |
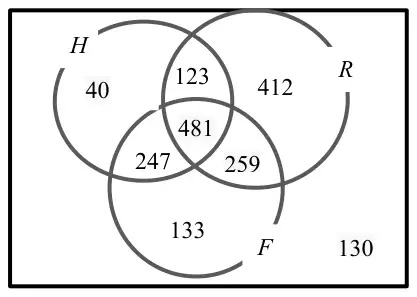 | B1 B1 A1 | 1.1b 1.1b 1.1b |
| (4) |
Notes
M1: Correct method to find one of the values 40 or 130 or 481 or 259
Implied by 40, 481, 259 or 130 seen in correct place on diagram
B1: One of the highlighted correct
B1: A second value highlighted correct or their \((\text{``}259\text{''} + \text{``}481\text{''}) = 740\) or their \((\text{``}40\text{''} + \text{``}481\text{''}) = 521\) or their \((\text{``}40\text{''} + \text{``}130\text{''}) = 170\)
A1: Fully correct
| Scheme | Marks | AO |
|---|---|---|
| \(\mathrm{P}(R^{\prime} \cap F) = \dfrac{380}{1825}\left[= \dfrac{76}{365} = 0.208\ldots\right]\) oe awrt 0.208 | B1 | 1.1b |
| (1) |
Notes
B1: 380/1825 oe or awrt 0.208
| Scheme | Marks | AO |
|---|---|---|
| \(\left[\dfrac{133 + \text{``}130\text{''}}{1825} =\right] \dfrac{\text{``}263\text{''}}{1825}\) awrt 0.144 | B1ft | 1.1b |
| (1) |
Notes
B1ft: Correct answer or
Ft their 130 (> 0) do not allow if blank
Allow ft correct to 3 sf.
| Scheme | Marks | AO |
|---|---|---|
| \(\dfrac{247 + \text{``}481\text{''}}{247 + \text{``}481\text{''} + 123 + \text{``}40\text{''}}\) | M1 | 3.4 |
| \(= \dfrac{728}{891}\) awrt 0.817 | A1 | 1.1b |
| (2) | ||
| (10 marks) |
Notes
M1: For a single fraction with the numerator < denominator and \(n\) is an integer we will award for \(n/891\) or \(n/\)(sum of their 4 values in \(H\), each > 0) or awrt 0.817
A1: 728/891 oe or awrt 0.817