
October 2021 Paper 2 Q6
6 Alex is investigating the area, \(A\), under the graph of \(y = x^2\) between \(x = 1\) and \(x = 1.5\). They draw the graph, together with rectangles of width \(\delta x = 0.1\), and varying heights \(y\).
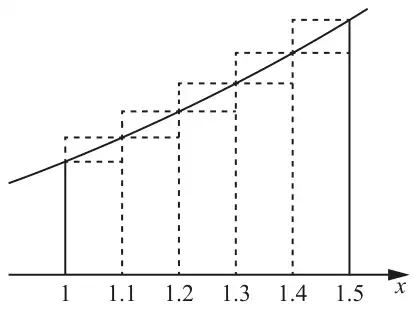
(a) Use the rectangles in the diagram to show that lower and upper bounds for the area \(A\) are 0.73 and 0.855 respectively. [1]
(b) Alex finds lower and upper bounds for the area \(A\), using widths \(\delta x\) of decreasing size.
The results are shown in the table. Where relevant, values are given correct to 3 significant figures.
Use Alex’s results to estimate the value of \(A\) correct to 2 significant figures. Give a brief justification for your estimate. [2]
The results are shown in the table. Where relevant, values are given correct to 3 significant figures.
| Width \(\delta x\) | 0.1 | 0.05 | 0.025 | 0.0125 |
|---|---|---|---|---|
| Lower bound for area \(A\) | 0.73 | 0.761 | 0.776 | 0.784 |
| Upper bound for area \(A\) | 0.855 | 0.823 | 0.807 | 0.799 |
(c) Write down an expression, in terms of \(y\) and \(\delta x\), for the exact value of the area \(A\). [2]
| Scheme | Marks |
|---|---|
| \(0.1(1 + 1.1^2 + 1.2^2 + 1.3^2 + 1.4^2)\) \(0.1(1.1^2 + 1.2^2 + 1.3^2 + 1.4^2 + 1.5^2)\) | B1 |
| [1] |
Notes
NB. Check working
Both seen oe
| Scheme | Marks |
|---|---|
| 0.79 | B1 |
| About half way between the last two bounds or \((0.784 + 0.799) \div 2 = 0.79\) Ignore all else | B1 |
| [2] |
Notes
B1: Not 0.7915
B1: condone "The mean of the last two bounds" or other sensible
Allow UB and LB are converging towards 0.79 oe
The two B1 marks are independent
| Scheme | Marks |
|---|---|
| \(\displaystyle\lim_{\delta x \to 0} \sum_{x=1}^{1.5} y\,\delta x\) | B1 B1 |
| [2] |
Notes
B1 for \(\displaystyle\lim_{\delta x \to 0} \sum y\,\delta x\). Allow \(x^2\) instead of \(y\)
B1 for limits, dep using \(\Sigma\) not integral. \(\displaystyle\lim_{\delta x \to 0} \sum_{1}^{1.5} y\,\delta x\) B1B0