
June 2023 Paper 2 Q8
8 The stem-and-leaf diagram shows the heights, in centimetres, of 15 plants.
| 0 | 2 |
| 1 | 0 |
| 2 | 4 |
| 3 | 0 2 4 9 |
| 4 | 1 2 4 7 9 |
| 5 | 3 7 |
| 6 | 2 |
Key: 2 | 5 means 25 cm.
A statistician intends to analyse the data, but wants to ignore any outliers before doing so.
| Scheme | Marks | AO |
|---|---|---|
| Median = 41 | B1 | 1.1 |
| Quartiles = 30, 49 | B1 | 1.1 |
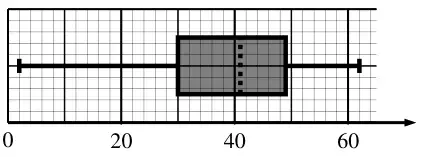 | B1FT | 1.2 |
| B1 | 1.2 | |
| [4] |
Notes
B1: (Median) Stated or shown on diagram (need not be labelled)
B1: (Quartiles) Stated or shown on diagram (need not be labelled)
B1FT: Correct diagram, FT their median & quartiles & correct end points shown (2, 62) – all correct to +/−0.5
(Must see a box with a vertical line and two whiskers)
B1: An appropriate linear scale, consistently labelled. (This mark can only be awarded if a box-and-whisker plot is drawn)
| Scheme | Marks | AO |
|---|---|---|
| Using \(Q_1 - 1.5 \times IQR\) or \(Q_3 + 1.5 \times IQR\) | M1 | 1.1 |
| \(30 - 1.5 \times (49 - 30) = 1.5\) AND \(49 + 1.5 \times (49 - 30) = 77.5\) | A1 | 1.1 |
| So no (lower) outliers and no (upper) outliers | A1 | 2.3 |
| [3] |
Notes
M1: Attempting to calculate either with their quartiles (may be implied by 1.5 or 77.5)
A1: Must see both correct calculations or both 1.5 and 77.5
A1: www (so must be from correct calculations)
Accept a single statement of ‘no outliers’ following correct calculations oe e.g. ‘no heights should be ignored’
Alternative using mean and sd
| Scheme | Marks |
|---|---|
| \(\mu \pm 2\sigma = 37.7 \pm 2 \times 16.0\) | M1 |
| \(\mu + 2\sigma = 69.6\) (3sf) Hence no (upper) outliers | A1 |
| \(\mu - 2\sigma = 5.83\) (3sf) Hence one (lower) outlier (2) | A1 |
M1: Calculating either \(\mu \pm 2\sigma\) with sensible values \(\mu \in [35, 40]\) \(\sigma \in [14, 19]\)
A1: Must see correct calculation or value and statement
A1: Must see correct calculation or value and statement