
June 2025 Paper 3 Q16
16 The distance, in kilometres, travelled from home to work by 340 individuals is shown in the histogram.
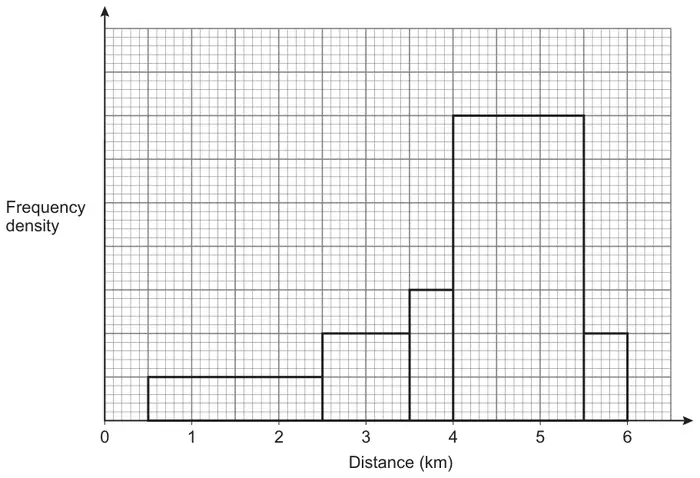
(a)
(i) Estimate the number of individuals who travel between 3 km and 5 km from home to work.
Fully justify your answer.
[4 marks](ii) Give one reason why your answer to part (a)(i) is only an estimate. [1 mark]
(b) The histogram shows that the data is skewed.
State the type of skewness.
[1 mark](c) Explain why frequency density is used in this histogram. [1 mark]
| Scheme | Marks | AO |
|---|---|---|
| (i) Adds the correct area of each rectangle using scale factor eg. \(17x\) or states that there are 34 big (cm) squares or states that there are 850 small (2mm) squares PI by their ratio or 1cm = 20 seen on the vertical scale or by correct answer | M1 | 3.1a |
| Calculates their ratio PI by eg 340 ÷ their 17 or 20 or 340 ÷ their 34 or 10 or 340 ÷ their 850 or 0.4 or by correct answer May be been seen in calculation PI by their ratio or 1cm = 20 seen on the vertical scale without incorrect working | M1 | 1.1a |
| States one of 340 ÷ their 17 × 9.5 340 ÷ their 34 × 19 340 ÷ their 850 × 475 May be embedded in calculation PI by correct answer | M1 | 3.1a |
| Obtains 190 | A1 | 1.1b |
| (4) | ||
(ii) States one of the following reasons
| E1 | 3.5b |
| (1) |
Typical solution
(a)(i)
Total area of rectangles
\[= 2 \times 1 + 1 \times 2 + 0.5 \times 3 + 1.5 \times 7 + 0.5 \times 2\]\[= 17\]\[340 \div 17 = 20\]Total number of individuals who travel between 3 km and 5 km
\[= 20 \times (0.5 \times 2 + 0.5 \times 3 + 1 \times 7)\]\[= 20 \times 9.5\]\[= 190\](a)(ii)
The actual distance for each person is unknown
| Scheme | Marks | AO |
|---|---|---|
| States ‘negative’ | B1 | 2.2b |
| (1) |
Typical solution
Negative
| Scheme | Marks | AO |
|---|---|---|
States one of the following reasons
| E1 | 2.4 |
| (1) | ||
| (7 marks) |
Typical solution
Class widths are different.