June 2025 Paper 3 Q13
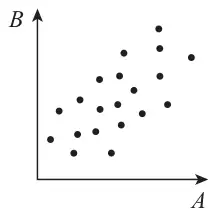
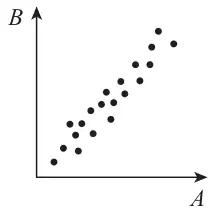
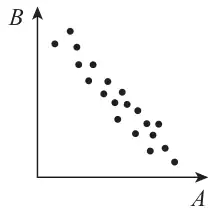
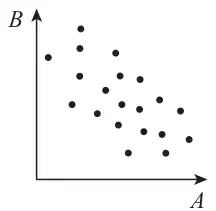
13 The variables \(A\) and \(B\) have a product moment correlation coefficient of 0.47
Identify which one of the scatter diagrams shows the relationship between \(A\) and \(B\).
Tick (✓) one box. [1 mark]
| Scheme | Marks | AO |
|---|---|---|
| Ticks the bottom right box | B1 | 2.2b |
| (1 mark) |
Typical solution