
June 2025 Paper 2 Q12
12 A particle moves in a straight line for 8 seconds.
The velocity \(v\), in \(\text{m s}^{-1}\), of the particle at time \(t\) seconds is shown in the diagram.
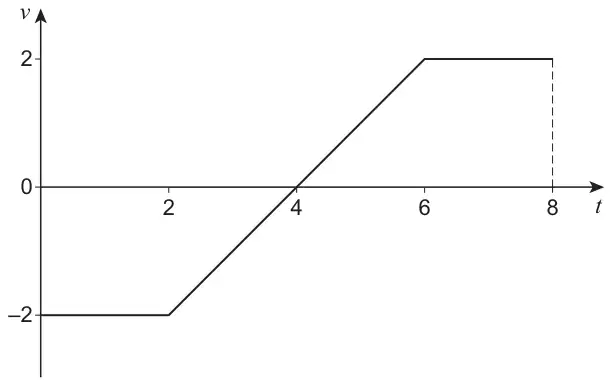
Find the displacement, in metres, of the particle after 8 seconds.
Circle your answer. [1 mark]
- \(-12\)
- 0
- 6
- 12
| Scheme | Marks | AO |
|---|---|---|
| Circles the second answer | B1 | 2.2a |
| (1 mark) |
Typical solution
0