
June 2025 Paper 2 Q9
9 Some students in a year-group took two tests, Test 1 and Test 2. The maximum mark in each test was 120.
The students’ marks are illustrated in the cumulative frequency diagram. The diagram is reproduced in the Printed Answer Booklet.
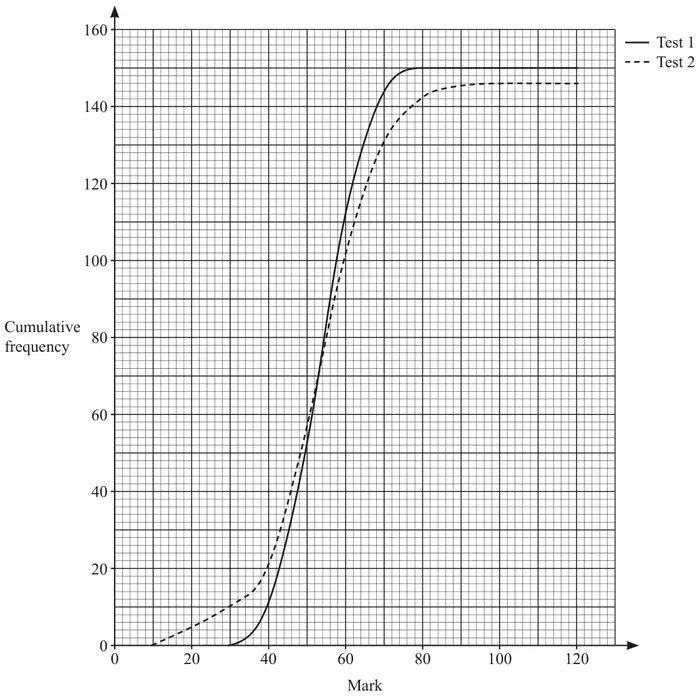
State the number of students who missed Test 2. [1]
For Test 1, explain what this means about the results. [1]
Find the minimum mark for grade A* on Test 1. [1]
A teacher commented that the median marks on both tests were very similar. This suggests that, on average, the levels of difficulty on both tests were about the same.
The marks for Test 1 are summarised in the table.
| Test 1 mark | \(\leqslant 29\) | 30–39 | 40–49 | 50–59 | 60–69 | 70–79 | \(\geqslant 80\) |
|---|---|---|---|---|---|---|---|
| Frequency | 0 | 10 | 40 | 60 | 33 | 7 | 0 |
| Scheme | Marks | AO |
|---|---|---|
| 4 | B1 | 3.1a |
| [1] |
| Scheme | Marks | AO |
|---|---|---|
| [Number of students scoring \(\leqslant 45\)] \(= 28\) [Number of students scoring \(\leqslant 65\)] \(= 130\) | M1 | 3.1a |
| [Number of students scoring between 45-65 is:] \(130 - 28 = 102\) | A1 | 1.1 |
| [2] |
Notes
M1: Two appropriate values in the following ranges (selected and used):
Value in range [26,32]
Value in range [128,134]
A1: Value in range [96,108]
If no working seen, award 2/2 marks for a correct answer in [96,108]
| Scheme | Marks | AO |
|---|---|---|
| No student scored more than 78 marks | B1 | 2.2a |
| [1] |
Notes
B1: Must include a value in range [76,80]
Condone ‘the maximum mark [scored by a student] was 78’ but not ‘the maximum possible mark was…’
| Scheme | Marks | AO |
|---|---|---|
| 69 | B1 | 2.2a |
| [1] |
Notes
B1: Value in range [68,70]
| Scheme | Marks | AO |
|---|---|---|
| The easier questions on Test 1 are easier than the easier questions on Test 2. | B1 | 3.2a |
| [1] |
Notes
B1: Must be referring to the easier questions but could refer to e.g. ‘minimum mark’ or ‘starting score’ or ‘bottom of graph’
Accept e.g.:
- The easier questions on Test 2 are harder [than the easier questions on Test 1]
- Lower-attaining (weaker) students scored better on Test 1
- On Test 2 some people have marks lower than… whereas on Test 1 the minimum mark was…
- Test 1 had more easier questions (or Test 2 had fewer easier questions)
But not e.g.:
- Test 1 had easier questions.
- References to A* boundary (i.e. harder questions)
| Scheme | Marks | AO |
|---|---|---|
| (i) \(\bar{x} = \dfrac{34.5 \times 10 + 44.5 \times 40 + 54.5 \times 60 + 64.5 \times 33 + 74.5 \times 7}{150}\) | M1 | 1.1 |
| \(\bar{x} = 53.6\) (3sf) | A1 | 1.1 |
| \(s = 9.66\) (3sf) | B1 | 1.1 |
| [3] | ||
| (ii) \(53.6 \pm 2 \times 9.66\) [\(= 34.3\) and \(72.9\)] | M1 | 1.1 |
| There may be outliers [in the 30-39 and 70-79 classes]. | A1 | 2.2b |
| [2] |
Notes
(f)(i)
M1: Correct method for mean soi, using attempted midpts soi (allow incorrect midpoints but not use of boundary values)
Should see midpoints multiplied by frequencies and summation implied. NB \(\Sigma x = 8045\), \(\Sigma x^2 = 445467.5\)
May be implied by correct answer (A1)
A1: awrt 53.6
B1: awrt 9.66
(f)(ii)
M1: FT their (f)(i) i.e. \(\bar{x} \pm 2 \times s\). Allow this mark for correct values seen.
A1: Dependent on correct values to 2sf (awrt 34 and 73)
Accept “there are outliers at both ends”
Condone ‘there are outliers’
SCB1 for \(53.6 \pm 3 \times 9.66 = 24.6\) and \(82.6\) (3sf) so no outliers (1/2)