
June 2024 Paper 2 Q11
11 A householder is investigating whether there is any relationship between his monthly cost of gas and his monthly cost of electricity, both measured in pounds (£). The householder collects a random sample of monthly costs and presents them in the scatter diagram below.
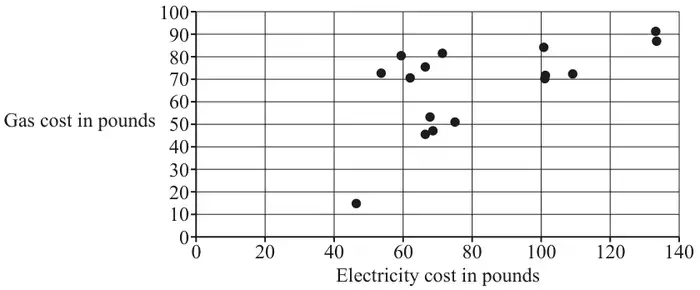
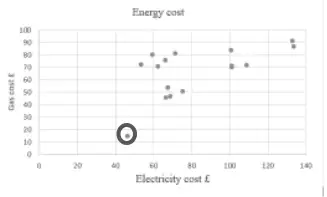
One of the points on the diagram represents the energy costs in a month when the householder was away on holiday for three weeks. The other points represent the energy costs in months when the householder did not go away on holiday.
The householder decides to test whether there is evidence to suggest that there is any association between the monthly cost of gas and the monthly cost of electricity. The value of Spearman’s rank correlation coefficient for this sample is 0.4359 and the associated \(p\)-value is 0.091 95.
| Scheme | Marks | AO |
|---|---|---|
 | B1 | 2.2b |
| [1] |
| Scheme | Marks | AO |
|---|---|---|
| (weak) positive association or (weak) positive correlation | B1 | 1.1 |
| [1] |
Notes
B1: allow eg as cost of electricity increases, cost of gas increases oe
| Scheme | Marks | AO |
|---|---|---|
| 0.09195 correctly compared with 0.05 or 0.025 only | M1 | 3.4 |
| \(0.09195 \gt 0.025\) | A1 | 1.1 |
| insufficient evidence [at the 5% level] to suggest any association between cost of gas and cost of electricity isw | A1 | 2.2b |
| [3] |
Notes
M1: allow eg “\(p\)-value \(\gt 0.05\)”
A1: allow \(p\)-value \(\gt 0.025\)
A1: A0 if refers to correlation rather than association; dependent on award of previous A1