
June 2025 Paper 2 Q8
8 At the end of the summer term all 120 Year 8 pupils at Oakmount College sit the same mathematics examination.
The marks obtained by the pupils in the 2024 examination are summarised in the table.
| Mark | 11–20 | 21–30 | 31–40 | 41–50 | 51–60 | 61–70 | 71–80 | 81–90 | 91–100 |
|---|---|---|---|---|---|---|---|---|---|
| Frequency | 8 | 12 | 24 | 17 | 23 | 16 | 10 | 7 | 3 |
Software is used to produce the cumulative frequency curve shown below.
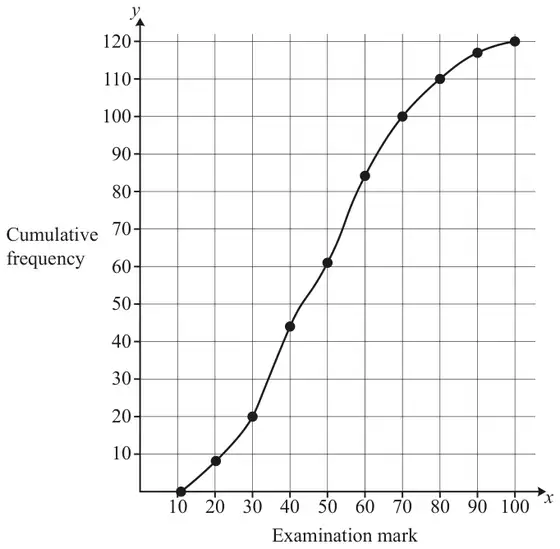
(a) It is proposed that the 30 pupils with the best marks in the examination are placed in the top set in Year 9.
Use the copy of the cumulative frequency curve in the Printed Answer Booklet to determine an estimate of the lowest mark needed for a pupil to be placed in the top set. [2]
Use the copy of the cumulative frequency curve in the Printed Answer Booklet to determine an estimate of the lowest mark needed for a pupil to be placed in the top set. [2]
(b) The person who will teach the top set states that pupils will not manage in this class unless they obtain at least 75 marks in the examination.
Use the copy of the cumulative frequency curve in the Printed Answer Booklet to determine an estimate of how many pupils will be in the top set if the lowest mark is set at 75. [2]
Use the copy of the cumulative frequency curve in the Printed Answer Booklet to determine an estimate of how many pupils will be in the top set if the lowest mark is set at 75. [2]
| Scheme | Marks | AO |
|---|---|---|
| eg horizontal line at cf = 90 or 91; eg curve marked at cf = 90 or 91 and mark stated eg vertical axis marked at 90 or 91 and mark stated eg horizontal axis marked between 60 and 65 and mark stated | M1 | 1.1 |
| 62, 63 or 64 | A1 | 1.1 |
| [2] |
Notes
M1: allow if seen on diagram for part (b)
A1: if M0 allow B1 for 62, 63 or 64
| Scheme | Marks | AO |
|---|---|---|
| eg vertical line from mark = 75 eg curve marked at \(x\) = 75 and cf stated eg horizontal axis marked at 75 and cf stated eg vertical axis marked at 104 – 106 and cf stated | M1 | 1.1 |
| 14, 15 or 16 | A1 | 1.1 |
| [2] |
Notes
M1: allow if seen on diagram for part (a)
A1: if M0 allow B1 for 14, 15 or 16