
C1 June 2010 Q6
6.
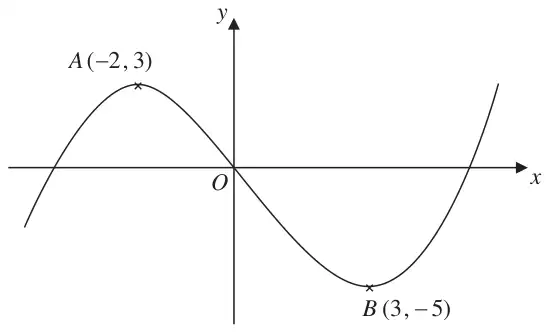
Figure 1 shows a sketch of the curve with equation \(y = \mathrm{f}(x)\). The curve has a maximum point \(A\) at \((-2, 3)\) and a minimum point \(B\) at \((3, -5)\).
On separate diagrams sketch the curve with equation
On each diagram show clearly the coordinates of the maximum and minimum points.
The graph of \(y = \mathrm{f}(x) + a\) has a minimum at \((3, 0)\), where \(a\) is a constant.
| Scheme | Marks |
|---|---|
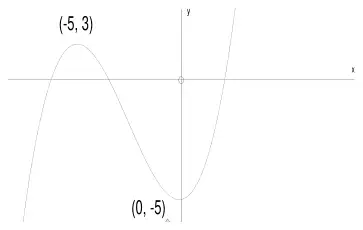
| Horizontal translation of \(\pm 3\) | M1 |
| \((-5, 3)\) marked on sketch or in text | B1 |
| \((0, -5)\) and min intentionally on \(y\)-axis Condone \((-5, 0)\) if correctly placed on negative \(y\)-axis | A1 |
| (3) |
Notes
Turning points (not on axes) should have both co-ordinates given in form\((x,y)\).
Do not accept points marked on axes e.g. \(-5\)on \(x\)-axis and 3 on \(y\)-axis is not sufficient.
For repeated offenders apply this penalty once only at first offence and condone elsewhere.
In (a) and (b) no graphs means no marks.
In (a) and (b) the ends of the graphs do not need to cross the axes provided max and min are clear
M1: for a horizontal translation of \(\pm 3\) so accept
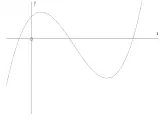
i.e max in 1st quad and coordinates of \((1, 3)\) or \((6, -5)\) seen.
[Horizontal translation to the left should have a min on the \(y\)-axis]
If curve passes through \((0,0)\) then M0 (and A0) but they could score the B1 mark.
A1: for minimum clearly on negative \(y\)-axis and at least \(-5\) marked on \(y\)-axis.
Allow this mark if the minimum is very close and the point \((0, -5)\) clearly indicated
| Scheme | Marks |
|---|---|
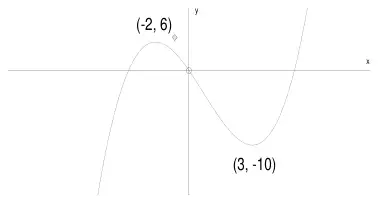
| Correct shape and intentionally through \((0,0)\) between the max and min | B1 |
| \((-2, 6)\) marked on graph or in text | B1 |
| \((3, -10)\) marked on graph or in text | B1 |
| (3) |
Notes
Turning points (not on axes) should have both co-ordinates given in form\((x,y)\).
Do not accept points marked on axes e.g. \(-5\)on \(x\)-axis and 3 on \(y\)-axis is not sufficient.
For repeated offenders apply this penalty once only at first offence and condone elsewhere.
In (a) and (b) no graphs means no marks.
In (a) and (b) the ends of the graphs do not need to cross the axes provided max and min are clear
1st B1: Ignore coordinates for this mark
Coordinates or points on sketch override coordinates given in the text.
Condone \((y, x)\) confusion for points on axes only. So \((-5,0)\) for \((0, -5)\) is OK if the point is marked correctly but \((3,10)\) is B0 even if in 4th quadrant.
| Scheme | Marks |
|---|---|
| \((a =)\ \underline{5}\) | B1 |
| (1) | |
| (7 marks) |
Notes
This may be at the bottom of a page or in the question...make sure you scroll up and down!