
C1 January 2009 Q5
5.
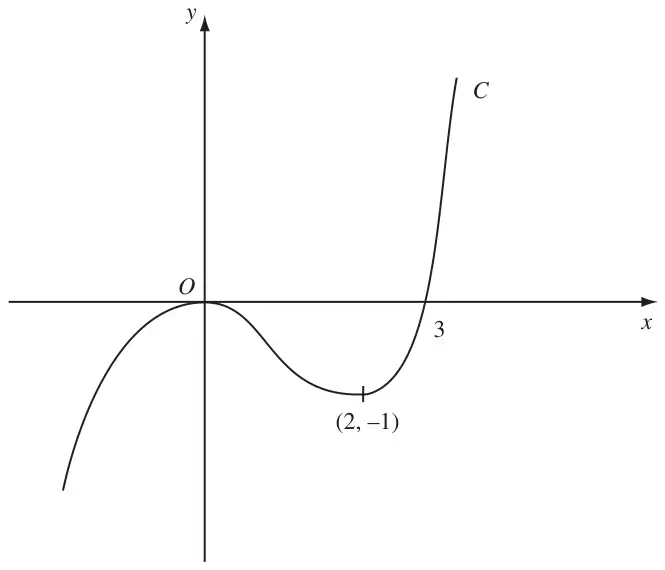
Figure 1 shows a sketch of the curve \(C\) with equation \(y = \mathrm{f}(x)\). There is a maximum at \((0, 0)\), a minimum at \((2, -1)\) and \(C\) passes through \((3, 0)\).
On separate diagrams sketch the curve with equation
On each diagram show clearly the coordinates of the maximum point, the minimum point and any points of intersection with the \(x\)-axis.
| Scheme | Marks |
|---|---|
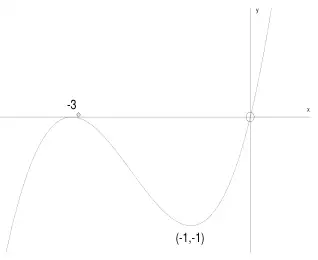
Shape  , touching the \(x\)-axis at its maximum. | M1 |
| Through \((0,0)\) & \(-3\) marked on \(x\)-axis, or \((-3, 0)\) seen. Allow \((0, -3)\) if marked on the \(x\)-axis. Marked in the correct place, but 3, is A0. | A1 |
| Min at \((-1, -1)\) | A1 |
| (3) |
Notes
M1 as described above. Be generous, even when the curve seems to be composed of straight line segments, but there must be a discernible ‘curve’ at the max. and min.
1st A1: for curve passing through \(-3\) and the origin. Max at \((-3, 0)\)
2nd A1: for minimum at \((-1, -1)\). Can simply be indicated on sketch.
In each part the \((0, 0)\) does not need to be written to score the second mark… having the curve pass through the origin is sufficient.
The last mark (for the minimum) in each part is dependent on a sketch being attempted, and the sketch must show the minimum in approximately the correct place (not, for example, \((-2, -1)\) marked in the wrong quadrant).
The mark for the minimum is not given for the coordinates just marked on the axes unless these are clearly linked to the minimum by vertical and horizontal lines.
| Scheme | Marks |
|---|---|
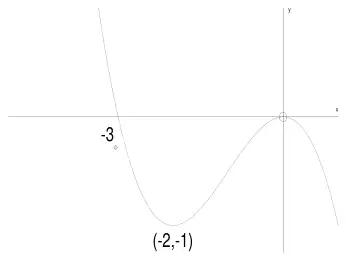
Correct shape  (top left - bottom right) | B1 |
| Through \(-3\) and max at \((0, 0)\). Marked in the correct place, but 3, is B0. | B1 |
| Min at \((-2, -1)\) | B1 |
| (3) | |
| (6 marks) |
Notes
1st B1: for the correct shape. A negative cubic passing from top left to bottom right.
Shape: Be generous, even when the curve seems to be composed of straight line segments, but there must be a discernible ‘curve’ at the max. and min.
2nd B1: for curve passing through \((-3, 0)\) having a max at \((0, 0)\) and no other max.
3rd B1: for minimum at \((-2, -1)\) and no other minimum.
If in correct quadrant but labelled, e.g. \((-2, 1)\), this is B0.
In each part the \((0, 0)\) does not need to be written to score the second mark… having the curve pass through the origin is sufficient.
The last mark (for the minimum) in each part is dependent on a sketch being attempted, and the sketch must show the minimum in approximately the correct place (not, for example, \((-2, -1)\) marked in the wrong quadrant).
The mark for the minimum is not given for the coordinates just marked on the axes unless these are clearly linked to the minimum by vertical and horizontal lines.