
June 2024 Paper 1 Q15
15 A graph indicating how the velocity, \(v\) m s−1, of a particle changes with respect to time, \(t\) seconds, is shown below.
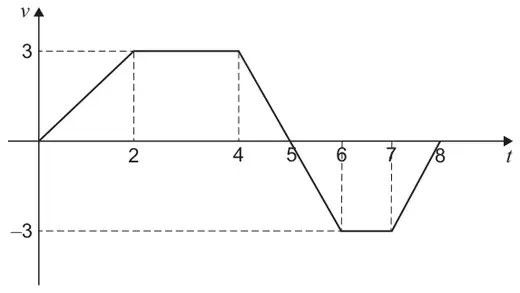
(a) Find the total distance travelled by the particle over the 8 second period shown. [3 marks]
(b) A student claims that
“The displacement of the particle is less than the distance travelled.”
State the range of values of \(t\) for which this claim is true. [1 mark]
| Scheme | Marks | AO |
|---|---|---|
| Finds any area from the graph | M1 | 3.1a |
| Obtains a fully correct expression for total area above or below axis PI by 4.5 | A1 | 1.1b |
| Obtains 16.5 m Condone missing units | A1 | 1.1b |
| (3) |
Typical solution
Area above axis = 10.5
Area below axis = 6
Total distance travelled = 16.5 m
| Scheme | Marks | AO |
|---|---|---|
| Obtains \(t \gt 5\) Ignore any upper bound of inequality provided it is 8 or more Do not accept \(t \geqslant 5\) | R1 | 2.2a |
| (1) | ||
| (4 marks) |