
June 2021 Paper 2 Q15
15 The number of hours of sunshine and the daily maximum temperature were recorded over a 9-day period in June at an English seaside town.
A scatter diagram representing the recorded data is shown below.
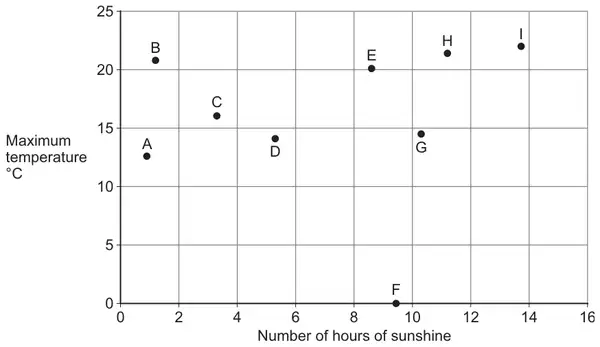
One of the points on the scatter diagram is an error.
(a)
(i) Write down the letter that identifies this point. [1 mark]
(ii) Suggest one possible action that could be taken to deal with this error. [1 mark]
(b) It is claimed that the scatter diagram proves that longer hours of sunshine cause higher maximum daily temperatures.
Comment on the validity of this claim. [1 mark]
| Scheme | Marks | AO |
|---|---|---|
| (i) Deduces the correct letter | B1 | 2.2a |
| (1) | ||
| (ii) States an appropriate action to deal with the error | E1 | 2.4 |
| (1) |
Typical solution
(i)
F
(ii)
Remove the point from the set of data
| Scheme | Marks | AO |
|---|---|---|
| Indicates somewhere in their response that the scatter diagram does not imply causality (ISW) Or Identifies any counter example from the data and concludes | E1 | 2.4 |
| (1) | ||
| (3 marks) |
Typical solution
The claim is invalid because correlation does not imply causality.