
June 2024 Paper 2 Q7
7
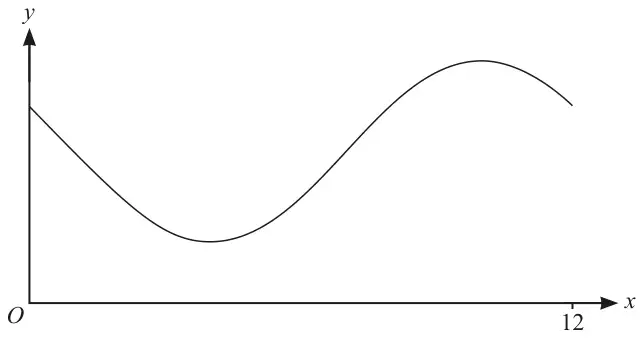
The diagram shows the curve with equation \(y = 5 + 3\cos(30x + 60)^\circ\), for \(0 \leqslant x \leqslant 12\).
There are two points on the curve for which the value of \(y\) is 7.
| Scheme | Marks | AO |
|---|---|---|
| (i) 8 | B1 | 1.1 |
| [1] | ||
| (ii) \(\cos(30x + 60) = 1\) | M1* | 1.1a |
| \(30x + 60 = 360\) | M1dep* | 1.1 |
| \(x = 10\) | A1 | 1.1 |
| [3] |
Notes
(a)(ii)
M1*: Setting \(\cos(30x + 60)\) equal to 1
Possibly implied by next mark
M1dep*: Set \(30x + 60\) equal to 360
May see \(x = -2 + 12\)
A1: The answer needs to come from sufficient working, if not M0 A0
SC B1 \(\cos(30x + 60) = k\) for \(0 \lt k \lt 1\) where \(k = \dfrac{\text{their (a)(i)} - 5}{3}\)
| Scheme | Marks | AO |
|---|---|---|
| \(5 + 3\cos(30x + 60) = 7\) \(\cos(30x + 60) = \tfrac{2}{3}\) | M1 | 1.1 |
| \((30x + 60 =)\ 48.18\ldots\) | A1 | 1.1 |
| \(30x + 60 = 360 - 48.18\ldots\) or \(360 + 48.18\ldots\) | M1 | 3.1a |
| \((x =)\ 8.39\) to 3 sf Allow awrt 8.39 | A1 | 1.1 |
| \((x =)\ 11.6\) to 3 sf Allow awrt 11.6 | A1 | 2.2a |
| [5] |
Notes
M1: Sets given equation equal to 7 and rearranges to obtain \(\cos(30x + 60) = k\) where \(-1 \lt k \lt 1\)
Condone sign errors in rearranging
A1: Finds the principal value of \(30x + 60\) (48.1896851…)
M1: At least one correct value of \(30x + 60\) using correct symmetry for cosine curve
A1: One correct value of \(x\) (in the interval \(0 \lt x \lt 12\)) (8.393677163…)
A1: Second correct value (11.60632284…)