
June 2019 Paper 1 Q12
12 The Venn diagram shows the numbers of students studying various subjects, in a year group of 100 students.
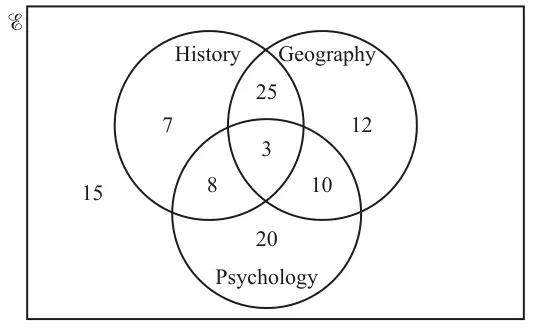
A student is chosen at random from the 100 students. Then another student is chosen from the remaining students.
Find the probability that the first student studies History and the second student studies Geography but not Psychology. [4]
| Scheme | Marks | AO |
|---|---|---|
| P(1st HGP′ & 2nd GP′ or 1st HGP & 2nd GP′ or 1st HG′ & 2nd GP′) \(= \dfrac{25}{100} \times \dfrac{36}{99} + \dfrac{3}{100} \times \dfrac{37}{99} + \dfrac{15}{100} \times \dfrac{37}{99}\) | M1 M1 | 3.1b 1.1 |
| M1 | 2.1 | |
| \(= \dfrac{87}{550}\) or 0.158 (3 sf) | A1 | 1.1 |
| [4] |
Notes
M1 M1: One of the following expressions seen: M1. Another seen: M1
\(\dfrac{25}{100} \times \dfrac{\cdots}{99}\) or \(\dfrac{3}{100} \times \dfrac{\cdots}{99}\) or \(\dfrac{15}{100} \times \dfrac{\cdots}{99}\) or \(\left(\dfrac{8}{100} \times \dfrac{\cdots}{99} + \dfrac{7}{100} \times \dfrac{\cdots}{99}\right)\)
M1: 3rd M1 for all correct
Alternative
P(1st HGP′ & 2nd GP′ or 1st {H – HGP′} & 2nd GP′)
\(= \dfrac{25}{100} \times \dfrac{36}{99} + \dfrac{18}{100} \times \dfrac{37}{99}\)
or \(\dfrac{43}{100}\left(\dfrac{25}{43} \times \dfrac{36}{99} + \dfrac{18}{43} \times \dfrac{37}{99}\right)\)
or \(\dfrac{18}{100} \times \dfrac{\cdots}{99}\) M2
or \(\dfrac{43}{100}\left(\dfrac{25}{43} \times \dfrac{\cdots}{99}\right)\) M1
or \(\dfrac{43}{100}\left(\dfrac{18}{43} \times \dfrac{\cdots}{99}\right)\) M2