
June 2025 Paper 2 Q7
7 The pre-release material contains data on household waste recycling rates and mean income of taxpayers in different areas of England.
The scatter diagram shows the household waste recycling rates and mean income of taxpayers for different areas of London in 2020/21.
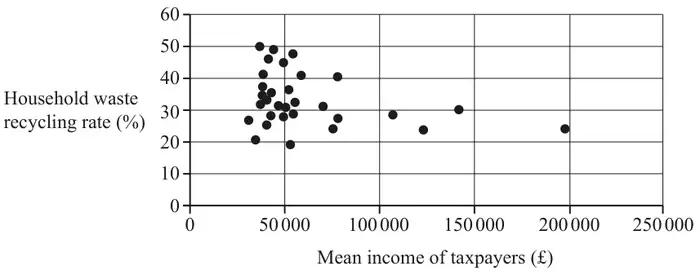
Explain why Umi might believe this is the case. [1]
Having inspected the diagram more closely, Umi believes that there are 4 outliers.
The table below shows further analysis of mean income of taxpayers and household waste recycling rates in 2020/21 in areas of London.
| Lower Quartile | Upper Quartile | |
|---|---|---|
| Mean income of taxpayers (£) | 40 350 | 64 300 |
| Household waste recycling rate (%) | 27.80 | 38.85 |
Umi removes all 4 points which they believe represent outliers and draws a new scatter diagram.
| Scheme | Marks | AO |
|---|---|---|
| Because it appears that as the mean income increases, the recycling rate decreases | B1 | 2.3 |
| [1] |
Notes
Higher rates of recycling occur for taxpayers with lower incomes or
If line of best fit were drawn it would have a negative gradient
| Scheme | Marks | AO |
|---|---|---|
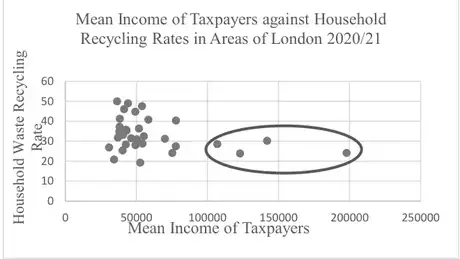 | B1 | 1.1 |
| [1] |
Notes
B1 for all 4 circled and no extras
| Scheme | Marks | AO |
|---|---|---|
| 64 300 + 1.5 × (64 300 – 40 350) = 100 225 | M1 | 2.1 |
| and the 4 outliers are all data points with mean income greater than 100 225, so this supports Umi’s statement | A1 | 2.4 |
| [2] |
Notes
M1: ignore calculations / comments concerning recycling rates. Accept UQ + \(M\) × IQR where \(M\) is a multiplying factor > 1
| Scheme | Marks | AO |
|---|---|---|
| Weak / no correlation | B1 | 2.2b |
| [1] |