
June 2025 Paper 2 Q5
5 All members of a class of year 9 pupils are asked to roll a fair dice a number of times, record the results and represent them using a suitable diagram.
Kai’s diagram is shown in Fig. 5.1.
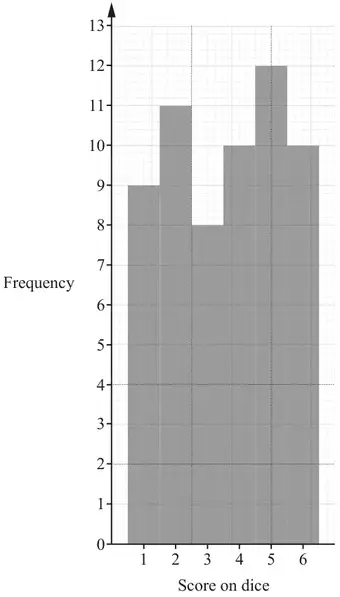
(a) Explain why Kai’s diagram is unsuitable for these data. [1]
Zayn’s diagram is shown in Fig. 5.2.
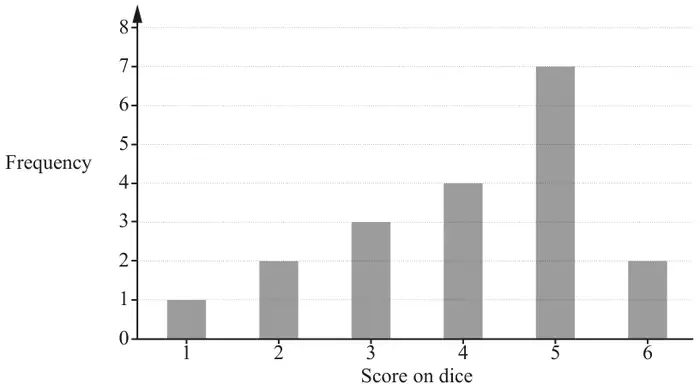
(b) Describe the shape of the distribution in Zayn’s diagram. [1]
Ali’s diagram is shown in Fig. 5.3.
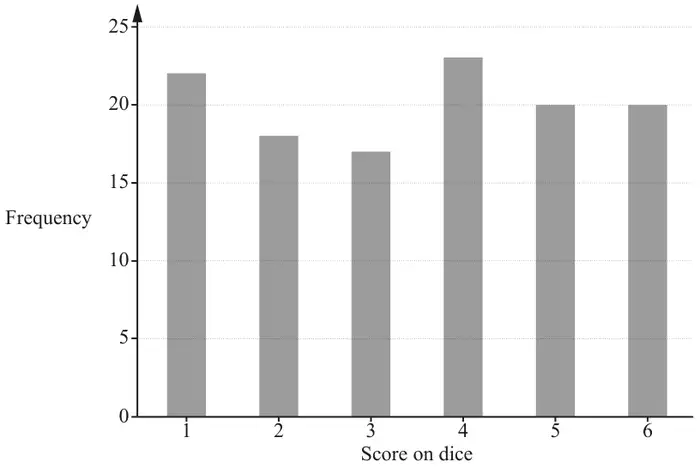
(c) Explain whose diagram is likely to be the most representative of the probability distribution of the score on a fair dice. [1]
| Scheme | Marks | AO |
|---|---|---|
| The data is discrete or Kai’s diagram is suitable for continuous data | B1 | 2.4 |
| [1] |
Notes
B0 if contradictory statements seen, otherwise ignore other statements.
| Scheme | Marks | AO |
|---|---|---|
| Negatively skewed | B1 | 1.2 |
| [1] |
| Scheme | Marks | AO |
|---|---|---|
| Ali’s graph (5.3), because Ali rolled the dice the most number of times | B1 | 3.5b |
| [1] |
Notes
or Ali’s graph, because it is the closest to the discrete uniform distribution
B0 if contradictory statements seen, otherwise ignore other statements.
Appendix: exemplar responses for Q5(c)
| Response | Mark |
|---|---|
| Ali’s as there are more rolls | B1 |
| Ali’s as each score is represented more equally, which is better as each score should have the same probability | B1 |
| Ali’s because her results aren’t biased towards one number | B0 |
| Ali’s because there are no outliers | B0 |
| Ali’s is most representative of a fair die | B0 |