
June 2025 Paper 2 Q4
4 The pre-release material contains data for percentage employment rates in different areas of England.
The diagram shows percentage employment rates between 2008 and 2022 for the North West of England and the South East of England.
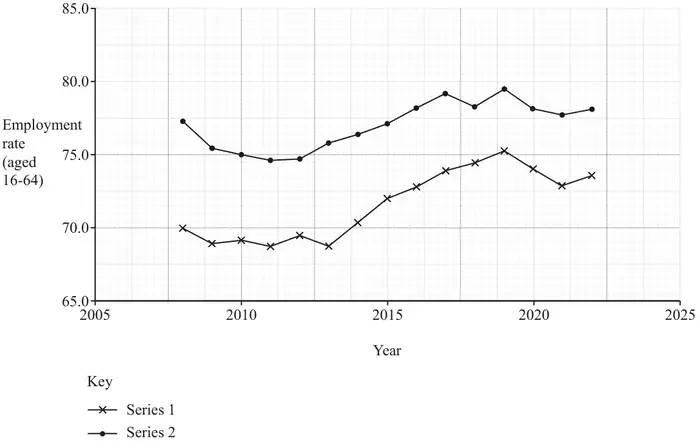
(a) Use your knowledge of the pre-release material to explain whether Series 1 (the lower time series) or Series 2 (the upper time series) represents the data for the South East of England. [1]
A student uses the LINEST function to model the data for Series 2.
(b) Assuming that a straight line model is reasonable, use your knowledge of the pre-release material to explain whether it would be appropriate to use this model to calculate an estimate of the percentage employment rate in Cornwall, in the South West of England, in 2011. [1]
| Scheme | Marks | AO |
|---|---|---|
| Series 2 represents SE England because employment rates are generally higher in this region (than in the North West) | B1 | 2.4 |
| [1] |
Notes
Accept: Series 2 represents SE England because employment rates are generally lower in the North West
| Scheme | Marks | AO |
|---|---|---|
| Not appropriate because (the pattern of) employment rates are different in different areas of England | B1 | 3.5a |
| [1] |