
June 2023 Paper 2 Q12
12 Doctors are investigating the weights of adult males registered at their surgery. One week they collect a sample by noting the weight in kilograms of all the adult males who have an appointment at their surgery.
They represent the data using a histogram.
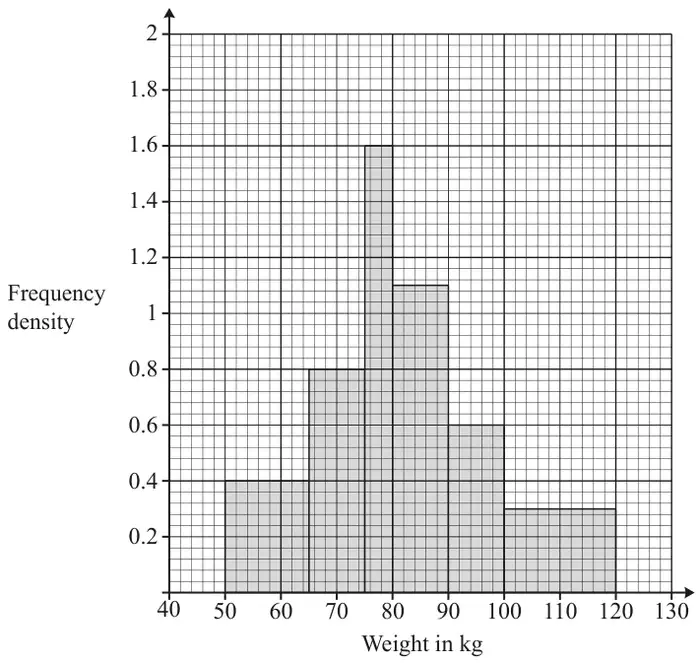
An incomplete frequency table for the data is shown below.
| Weight in kg | 50– | 65– | 75– | 80– | 90– | 100–120 |
| Frequency | 8 |
One of these patients is selected at random.
| Scheme | Marks | AO |
|---|---|---|
| Opportunity/Convenience sampling | B1 | 1.2 |
| [1] |
Notes
Condone ‘Opportunistic Sampling’
| Scheme | Marks | AO |
|---|---|---|
| Because every sample (of size n) does not have the same probability of being selected | B1 | 2.4 |
| [1] |
Notes
Accept ‘all adult males registered at the surgery do not have an equal chance of being selected’
Accept ‘everyone registered at the surgery does not have an equal chance of being selected
OR
‘For a SRS each element from the SF must have an equal chance of selection’
OR
‘A subset of the population cannot form a complete sampling frame’
OR
‘The sampling frame would be incomplete’
‘No random method employed in the process’ B0 (need to have the idea that the SF is incomplete)
‘Only collected data from one week’ is B0
| Scheme | Marks | AO | ||||||||||||||
|---|---|---|---|---|---|---|---|---|---|---|---|---|---|---|---|---|
| B1 | 1.1 | ||||||||||||||
| [1] |
Notes
(Corrected from the printed mark scheme: the third class is printed as ‘70-’; it is the 75–80 class, as in the question.)
| Scheme | Marks | AO |
|---|---|---|
| \(\frac{2}{3} \times\) their \(6 + \frac{1}{2} \times\) their \(6\) Or \((10 \times 0.4) + (10 \times 0.3)\) | M1 | 1.1 |
| \(\frac{7}{45}\) or \(0.1\dot{5}\) or 0.15555 to 0.156 Mark at most accurate | A1FT | 1.1 |
| [2] |
Notes
M1: IF part (c) is correct then this could be implied by ‘4 +3’
A1FT: FT their 6, 6 and 45. May need to check their calculation. May see interpolation methods, which lead to the same calc.
| Scheme | Marks | AO |
|---|---|---|
| The distribution of the weights within each class is unknown | E1 | 2.4 |
| [1] |
Notes
Accept ‘we assume that the values (individual weights) are equally distributed in each class interval’
Accept ‘the individual values (weights) are not known’
Accept ‘the number of people (frequency) in each category of the histogram may not be spread out equally across the category’
Accept ‘we don’t know exactly how many were less than 60kg and how many were more than 110kg’ (idea of correct frequency at both ends for correct probability calculation)