
October 2020 Paper 2 Q2
2 A student measures the upper arm lengths of a sample of 97 women. The results are summarised in the frequency table in Fig. 2.1.
| Arm length in cm | 30 – | 31 – | 32 – | 33 – | 34 – | 35 – | 36 – | 37 – | 38 – | 39 – | 40 – 41 |
| Frequency | 1 | 4 | 5 | 9 | 13 | 19 | 17 | 17 | 4 | 3 | 5 |
Fig. 2.1
The student constructs two cumulative frequency diagrams to represent the data using different class intervals. These are shown in Fig. 2.2 below.
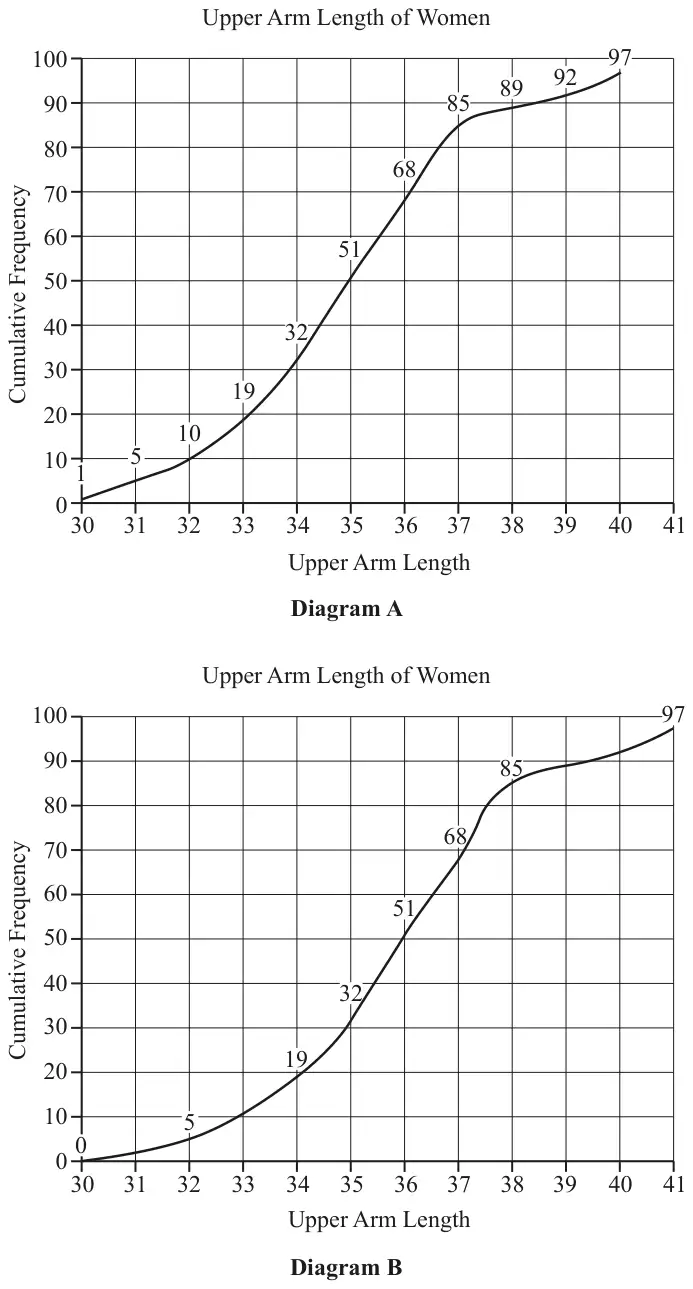
One of these diagrams is correct and the other is incorrect.
(a) State which diagram is incorrect, justifying your answer. [2]
(b) Use the correct diagram in Fig. 2.2 to find an estimate of the median. [1]
| Scheme | Marks | AO |
|---|---|---|
| Diagram A is incorrect | B1 | 2.2a |
| the cumulative frequencies have been plotted at the left hand end of each class interval, not at the right hand end | B1 | 2.3 |
| [2] |
Notes
B1: Accept diagram B is correct
B1: Oe, eg Used lower bound not upper bound
| Scheme | Marks | AO |
|---|---|---|
| 35.7 to 35.9 inclusive | B1 | 1.1 |
| [1] |
Notes
B1: From diagram, but ignore any calculation; allow even if wrong diagram given in (a).
If they say Diagram B is incorrect oe in (a), allow sc B1 for 34.7 to 34.9 inclusive