
October 2020 Statistics Q2
2. Jerry is studying visibility for Camborne using the large data set June 1987.
The table below contains two extracts from the large data set.
It shows the daily maximum relative humidity and the daily mean visibility.
| Date | Daily Maximum Relative Humidity | Daily Mean Visibility |
|---|---|---|
| Units | % | |
| 10/06/1987 | 90 | 5300 |
| 28/06/1987 | 100 | 0 |
(The units for Daily Mean Visibility are deliberately omitted.)
Given that daily mean visibility is given to the nearest 100,
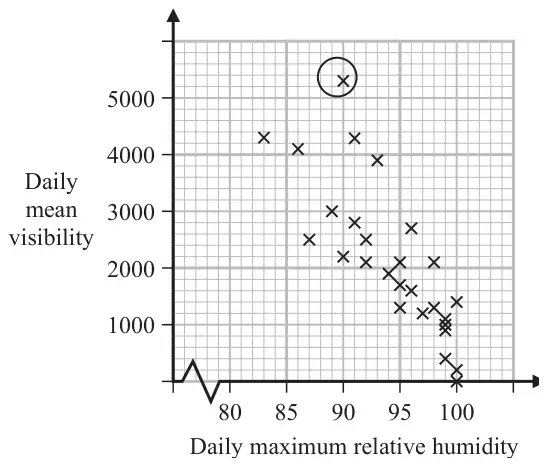
Jerry drew the following scatter diagram, Figure 2, and calculated some statistics using the June 1987 data for Camborne from the large data set.
| \(Q_1\) | IQR | |
|---|---|---|
| Daily mean visibility | 1100 | 1600 |
| Daily maximum relative humidity (%) | 92 | 8 |
Jerry defines an outlier as a value that is more than 1.5 times the interquartile range above \(Q_3\) or more than 1.5 times the interquartile range below \(Q_1\).
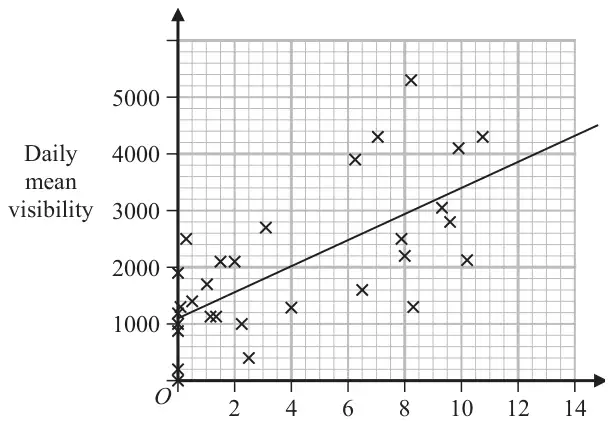
Jerry drew the following scatter diagram, Figure 3, using the June 1987 data for Camborne from the large data set, but forgot to label the \(x\)-axis.
| Scheme | Marks | AO |
|---|---|---|
| 0 to 500 m | B1 | 1.2 |
| (1) |
Notes
B1: For realising it is the maximum distance and distance given with correct units.
Allow 0 to 50dm or < 500m or < 50dm
| Scheme | Marks | AO |
|---|---|---|
| \(1100 + 1600 + 1.5 \times 1600\ [= 5100]\) | M1 | 2.1 |
| 5300 > 5100 therefore outlier | A1 | 1.1b |
| (2) |
Notes
M1: Attempt to find \(Q_3\) and the upper limit
A1: 5100, if a value for the point is stated it must be above 5100 otherwise it is A0. For a statement comparing and conclusion it is an outlier or it is above \(Q_3 + 1.5\text{IQR}\). Allow accept the point circled is greater than 5100 oe
| Scheme | Marks | AO |
|---|---|---|
| As the humidity increases the mean visibility decreases | B1 | 2.4 |
| (1) |
Notes
B1: For a suitable interpretation of a negative correlation mentioning humidity and visibility
| Scheme | Marks | AO |
|---|---|---|
| (Hours of) sunshine | B1 | 2.2b |
| (1) | ||
| (5 marks) |
Notes
B1: A correct deduction that the unlabelled variable is the hours of sunshine. Condone missing hours. Do not allow if more than one variable given.
Must be quantative variable
Not cloud cover since values bigger than 8
Not wind speed since values not integers
Not daily mean temperature since mean temperature near to zero are unlikely in June