
October 2020 Statistics Q1
1.
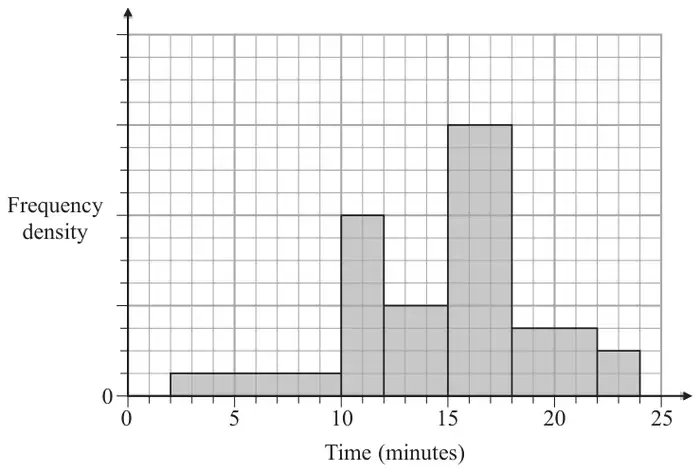
The histogram in Figure 1 shows the times taken to complete a crossword by a random sample of students.
The number of students who completed the crossword in more than 15 minutes is 78
Estimate the percentage of students who took less than 11 minutes to complete the crossword.
(4)
| Scheme | Marks | AO |
|---|---|---|
| 1 square is \(\dfrac{78}{12 \times 3 + 3 \times 4 + 2 \times 2} = \left[\dfrac{78}{52} = 1.5\right]\) and \((8 \times 1 + 1 \times 8) \times \text{``}1.5\text{''}\) | M1 | 3.1a |
| 24 students took less than 11 minutes | A1 | 1.1b |
| Percentage of students = \(\dfrac{\text{``}24\text{''}}{78 + \text{``}24\text{''} + 1 \times 8 \times \text{``}1.5\text{''} + 3 \times 4 \times \text{``}1.5\text{''}} \times 100\) | M1 | 3.1b |
| = 18.18… awrt 18% | A1 | 1.1b |
| (4) | ||
| Total 4 |
Notes
M1: For clear use of frequency density to establish the fd scale and then use the area to find frequency of <11 minutes. Allow maximum of 3 errors in either the heights or widths in total if working shown. They may calculate the area using other size squares.
Allow for realising they need to find the total number of squares (88) maximum of 4 errors in either the heights or widths and number < 11 minutes(16) - must have a maximum of 1 error in either the heights or widths (and not use the 78 as part of calulation)
A1: For correct values seen. Allow for 88 and 16
M1: For realising the need to find the total and calculating a percentage. ( with “their 24” as the numerator). Allow \((8 \times 1 + 2 \times 8) \times \text{``}1.5\text{''}\) instead of \(\text{``}24\text{''} + 1 \times 8 \times \text{``}1.5\text{''}\) If working shown can allow maximum of 2 errors in either the heights or widths in the calculation of the total.
Allow “their 24” / 132 oe
A1: awrt 18