
June 2018 Statistics Q4
4. Helen is studying the daily mean wind speed for Camborne using the large data set from 1987.
The data for one month are summarised in Table 1 below.
| Windspeed | n/a | 6 | 7 | 8 | 9 | 11 | 12 | 13 | 14 | 16 |
|---|---|---|---|---|---|---|---|---|---|---|
| Frequency | 13 | 2 | 3 | 2 | 2 | 3 | 1 | 2 | 1 | 2 |
Table 1
The means and standard deviations of the daily mean wind speed for the other months from the large data set for Camborne in 1987 are given in Table 2 below. The data are not in month order.
| Month | \(A\) | \(B\) | \(C\) | \(D\) | \(E\) |
|---|---|---|---|---|---|
| Mean | 7.58 | 8.26 | 8.57 | 8.57 | 11.57 |
| Standard Deviation | 2.93 | 3.89 | 3.46 | 3.87 | 4.64 |
Table 2
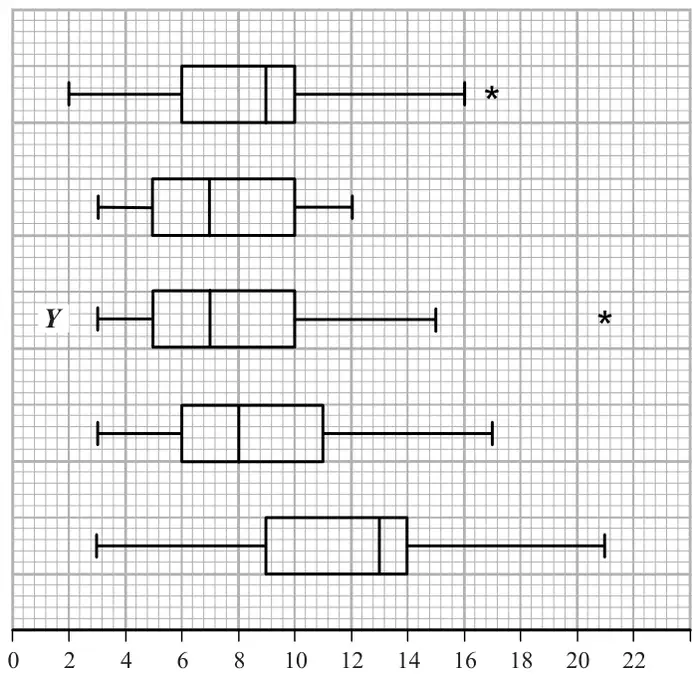
The data for these months are summarised in the box plots below. They are not in month order or the same order as in Table 2.
| Scheme | Marks | AO |
|---|---|---|
| \(\bar{x} = 10.2\,(2222\ldots)\) awrt 10.2 | B1 | 1.1b |
| (1) |
Notes
NB \(\bar{x} = \dfrac{184}{18}\) and \(\sigma_x = \sqrt{\dfrac{2062}{18} - \bar{x}^2}\)
B1 for \(\bar{x} = 10.2\) (allow exact fraction) [This is an LDS mark]
| Scheme | Marks | AO |
|---|---|---|
| \(\sigma_x = 3.17\,(20227\ldots)\) awrt 3.17 | B1ft | 1.1b |
| Sight of “knots” or “kn” (condone knots/s etc) | B1 | 1.2 |
| (2) |
Notes
NB \(\bar{x} = \dfrac{184}{18}\) and \(\sigma_x = \sqrt{\dfrac{2062}{18} - \bar{x}^2}\)
1st B1ft allow 3.2 from a correct expr’ accept \(s = 3.26(3984\ldots)\) [ft use of n/a]
Treating n/a as 0 May see \(n = 31\) or \(\bar{x} = 5.9354\ldots\) which is B0 in (a) but here in (b) it gives \(\sigma_x = 5.59(34\ldots)\) or \(s = 5.6858\ldots\) (awrt 5.69) and scores 1st B1
2nd B1 accept kn accept in (a) or (b) (allow nautical miles/hour) [This is an LDS mark]
| Scheme | Marks | AO |
|---|---|---|
| October ….. since | B1 | 2.2b |
| it is windier in the autumn or month of the hurricane or latest month in the year | B1 | 2.4 |
| (2) |
Notes
1st B1 choosing October but accept September. [This is an LDS mark]
2nd B1 for stating that (Camborne) is windier in autumn/winter months
“because it is winter/autumn/windier/colder in “month” ” Sep \(\leqslant\) "month" \(\leqslant\) Mar scores B1B1 for “month” = Sep or Oct and B0B1 for other months in range
| Scheme | Marks | AO |
|---|---|---|
| (i) They represent outliers | B1 | 1.2 |
| (ii) \(Y\) has low median so expect lowish mean (but outlier so \(\gt 7\)) and \(Y\) has big range/IQR or spread so expect larger st.dev | M1 | 2.4 |
| Suggests \(B\) | A1 | 2.2b |
| (3) | ||
| (8 marks) |
Notes
(d)(i) B1 for outlier or the idea of an extreme value allow “anomaly”
(ii) M1 for a comment relating to location that mentions both median and mean and a comment relating to spread that mentions both range/IQR and standard deviation and leads to choosing \(B\), \(C\) or \(D\)
Choosing \(A\) or \(E\) is M0
Incorrect/false statements score M0 e.g. \(Q_3 = (\text{mean} + \sigma)\) or identify \(Q_2 =\) mean or \(Y\) has small spread
ALT Use of outliers: outlier is \((\text{mean} + 3\sigma)\) \((B = 19.9)\), \((C = 18.95)\), \((D = 20.2)\)
Must see at least one of these values and compare to \(Y\)’s outlier [leads to \(D\) or \(B\)]
A1 for suitable inference i.e. \(B\) (accept \(D\) or \(B\) or \(D\)) M1 must be scored