
Numeracy Intermediate June 2017 Unit 1 Q11
11. The following box and whisker plots show the flow of water through a drain, measured in m3/s.
The flow of water was measured at 11 a.m. each day for the first 5 months of the year.
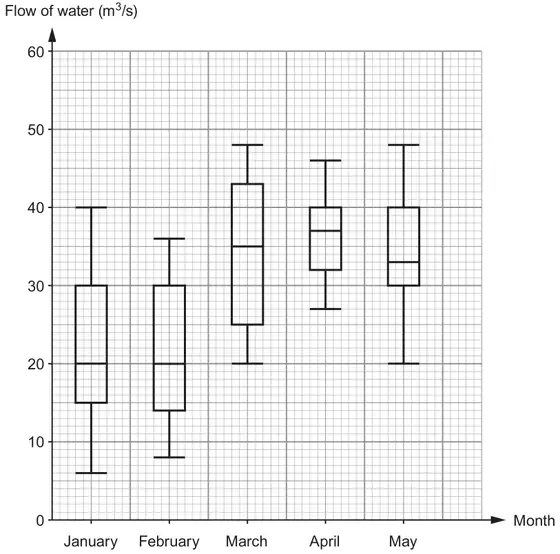
(a) In which of the five months was the median flow of water the greatest? [1]
(b) In which of the five months was the range of the flow of water the greatest? [1]
(c) Iona is writing some statements for a report on the flow of water through the drain.
Complete each of the statements given below.
Complete each of the statements given below.
(i) ‘Both the upper quartiles and medians in the months of ……………
and …………… were the same.’ [1]
and …………… were the same.’ [1]
(ii) ‘25% of the results in March show the flow of water was greater than
…………… m3/s.’ [1]
…………… m3/s.’ [1]
(d) Circle either TRUE or FALSE for each of the following statements. [2]
| 25% of the results in January show the flow of water was less than 6 m3/s. | TRUE | FALSE |
| The units, m3/s, measure the volume of water passing through the drain each second. | TRUE | FALSE |
| The mean flow of water in April was certainly greater than 36 m3/s. | TRUE | FALSE |
| The month with the greatest difference between the lower quartile and the median was May. | TRUE | FALSE |
| Scheme | Marks | Comments |
|---|---|---|
| April | B1 |
| Scheme | Marks | Comments |
|---|---|---|
| January | B1 |
| Scheme | Marks | Comments |
|---|---|---|
| (i) January and February | B1 | In either order |
| (ii) 43 | B1 |
| Scheme | Marks | Comments |
|---|---|---|
| FALSE TRUE FALSE FALSE | B2 | B1 for any 3 correct responses |