11. Two groups of people, \(A\) and \(B\), take part in a fun run. Everyone in the groups completes the run.
The table gives a summary of the times, \(t\) minutes, taken by group \(A\).
Minimum
Maximum
Median
Lower Quartile
Inter-quartile range
15·2
23·2
19·4
16·8
4·2
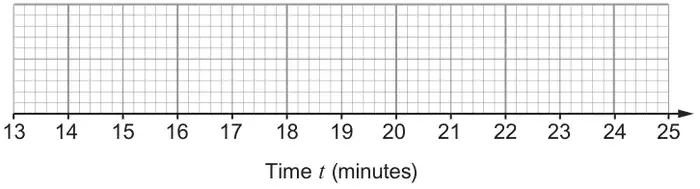
(a) On the grid below, draw a box plot to represent this data. [3]
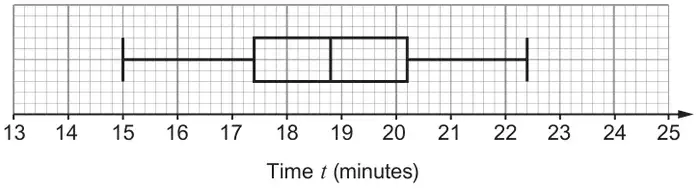
(b) The box plot below gives a summary of the times, \(t\) minutes, taken by group \(B\).Marcie makes two statements using information from the box plots. Are Marcie’s statements correct? Explain how you decide.
(i) “On average, runners in group \(B\) ran faster than runners in group \(A\).” [1]
Correct ☐ Not correct ☐
(ii) “There is a greater proportion of runners who took less than 17 minutes in group \(B\).” [1]
Correct ☐ Not correct ☐
Mark scheme (a)
Scheme
Marks
Comments
Correct box plot with: Median at 19.4 Lower quartile at 16.8 Upper quartile at 21.0 Left whisker to 15.2 Right whisker to 23.2
B3
B1 for UQ = 21(.0) si; may not be in a box plot B1 for LQ, Median, UQ positioned correctly in a box plot, B1 for correct whiskers
Mark scheme (b)
Scheme
Marks
Comments
(b)(i) Correct indicated and valid explanation e.g. ‘The median for group \(B\) is lower.’ or ‘The median (for group \(A\) is 19.4 and) for group \(B\) is 18.8.’
E1
(b)(ii) Not correct indicated and valid explanation e.g. ‘The lower quartile for \(B\) is more than 17 but the lower quartile for \(A\) is less than 17.’
E1
Allow: Not correct and ‘Group A had a lower quartile less than 17’
We'd like to use Google Analytics cookies to count visits and see which pages help most. They're optional, and the site works exactly the same either way. Privacy policy