
4400 Higher June 2006 Paper 3 Q19
19 The unfinished table and histogram give information about the times taken by some students to complete a science test.
| Time (\(t\) minutes) | Frequency |
|---|---|
| \(0 < t \leqslant 30\) | |
| \(30 < t \leqslant 50\) | 70 |
| \(50 < t \leqslant 70\) | 85 |
| \(70 < t \leqslant 80\) | |
| \(80 < t \leqslant 90\) | 40 |
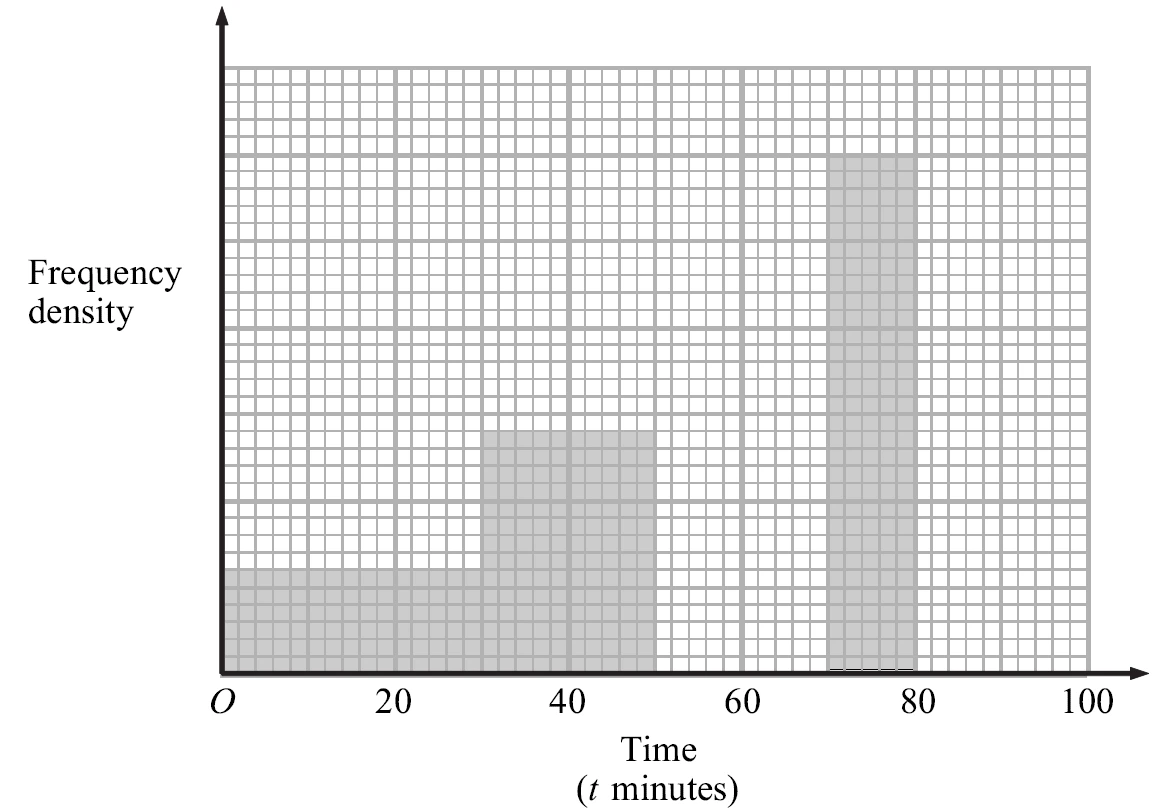
(a) Use the information in the table to complete the histogram. (2)
(b) Use the information in the histogram to complete the table. (2)
| Scheme | Marks |
|---|---|
| bar 17 sq high, 10 sq wide bar 16 sq high, 5 sq wide | B2 |
| (2) |
Notes
B2: B1 for each
NB \(80 < t \leqslant 90\)
CHECK: the source mark scheme labels this row (b) and the 45, 75 row (a); they have been swapped to match the question parts.
| Scheme | Marks |
|---|---|
| 45 \(\quad\) 75 | B2 |
| (2) | |
| (4 marks) |
Notes
B2: B1 for each