
4400 Higher June 2005 Paper 4 Q17
17 In an experiment, 52 plants were grown and their heights were measured.
The results are summarised in the table.
| Height | \(0 \leqslant h < 10\) | \(10 \leqslant h < 15\) | \(15 \leqslant h < 20\) | \(20 \leqslant h < 40\) |
|---|---|---|---|---|
| Number of plants | 10 | 20 | 14 | 8 |
(a) Complete the histogram for these results.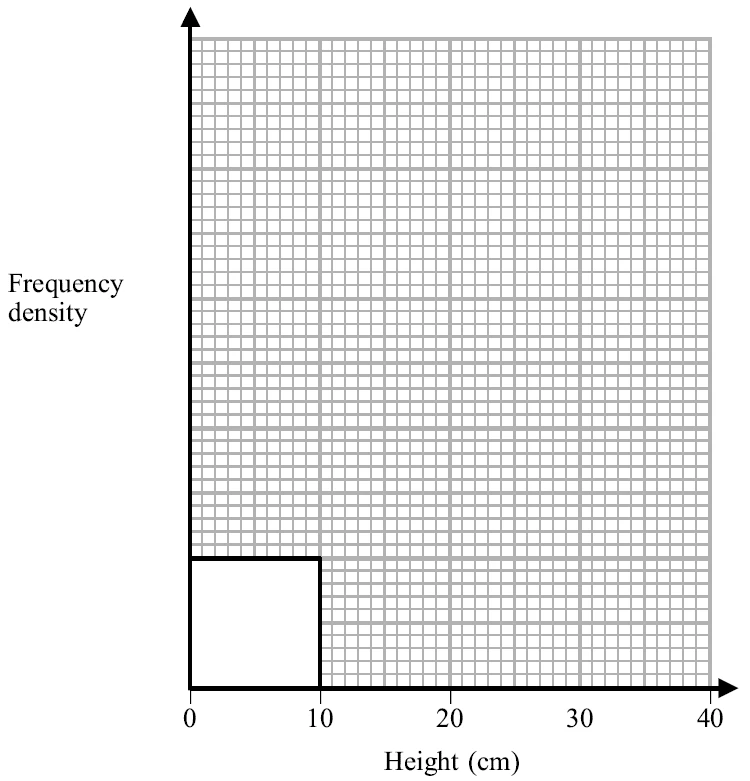
(4)
The plants with heights from 17.5 cm to 25 cm are chosen for a display.
(b) Calculate an estimate of the number of plants chosen for the display. (2)
| Scheme | Marks |
|---|---|
| One block of correct height, or \(\frac{20}{5}\) or \(\frac{14}{5}\) or \(\frac{8}{20}\) seen | M1 |
| Correct blocks, height & width | A1 A1 A1 |
| (4) |
Notes
M1: 8 cm, 5.6 cm or 0.8 cm, any width
| Scheme | Marks |
|---|---|
| \(\frac{1}{2} \times 14\) or \(\frac{1}{4} \times 8\) or 2.5 × 2.8 or 5 × 0.4 | M1 |
| 9 | A1 |
| (2) | |
| (6 marks) |
Notes
M1: Value “7” or “2” not enough