
4400 Higher June 2004 Paper 3 Q14
14 The unfinished table and histogram show information from a survey of women about the number of calories in the food they eat in one day.
| Number of calories (\(n\)) | Frequency |
|---|---|
| \(0 \lt n \leqslant 1000\) | 90 |
| \(1000 \lt n \leqslant 2000\) | |
| \(2000 \lt n \leqslant 2500\) | 140 |
| \(2500 \lt n \leqslant 4000\) |
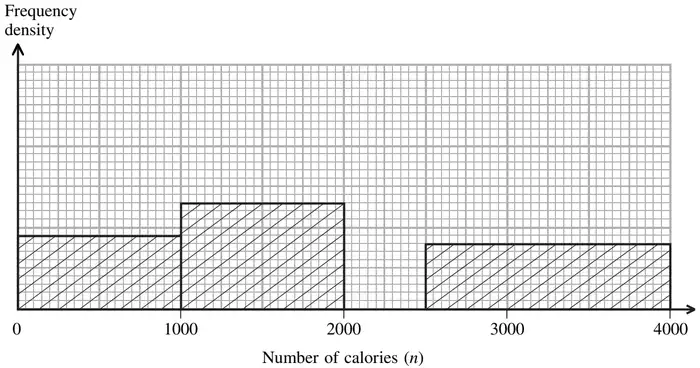
(a)
(i) Use the information in the table to complete the histogram.
(ii) Use the information in the histogram to complete the table. (3)
(b) Find an estimate for the upper quartile of the number of calories.
You must make your method clear. (2)
You must make your method clear. (2)
| Scheme | Marks |
|---|---|
| (i) Answer: bar correct | B1 |
| (ii) Answer: 130, 120 | B2 |
| (3) |
Notes
B1: 28 ± ½ sq
B2: B1 cao for each value
| Scheme | Marks |
|---|---|
| \(\Sigma f = 480\), \(\frac{3}{4} \times 480 = 360\) | M1 |
| 2500 | A1 |
| (2) | |
| (5 marks) |
Notes
A1: ft from “480” ie \(\Sigma f\)