
4MA0 Foundation June 2016 Paper 2R Q11
11 The bar chart gives information about the weight of tomatoes, in millions of tonnes, grown in five countries in 2012
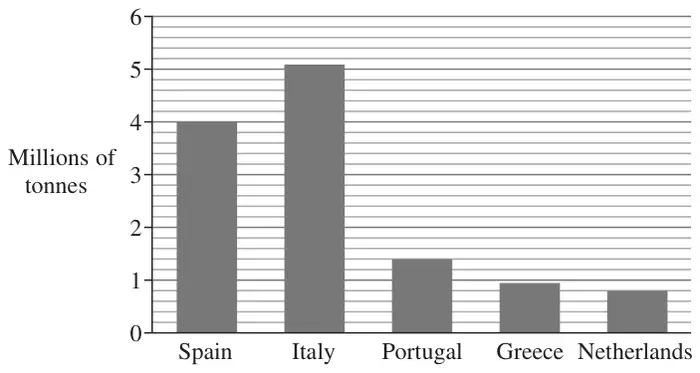
The weight of tomatoes grown in Spain in 2012 was greater than the weight of tomatoes grown in the Netherlands in 2012
(a) How much greater? (2)
The weight of tomatoes grown in Portugal in 2012 was 1400000 tonnes.
60% of these tomatoes were exported.
(b) Work out 60% of 1400000 (2)
In 2012, the weight of tomatoes grown in France was 0.6 million tonnes.
(c) Write the weight of tomatoes grown in France as a fraction of the weight of tomatoes grown in Spain.
Give your fraction in its simplest form. (2)
Give your fraction in its simplest form. (2)
| Scheme | Marks |
|---|---|
| 4 - 0.8 | M1 |
| 3.2 | A1 |
| (2) |
| Scheme | Marks |
|---|---|
| 1400000 × 60 ÷ 100 | M1 |
| 840 000 | A1 |
| (2) |
| Scheme | Marks |
|---|---|
| \(\dfrac{0.6}{4}\) | M1 |
| \(\dfrac{3}{20}\) | A1 |
| (2) |
Notes
M1: oe non – simpified form