
4MA0 Foundation June 2014 Paper 2 Q2
2 The pictogram shows information about the number of calculators sold each day from Monday to Friday in a shop.
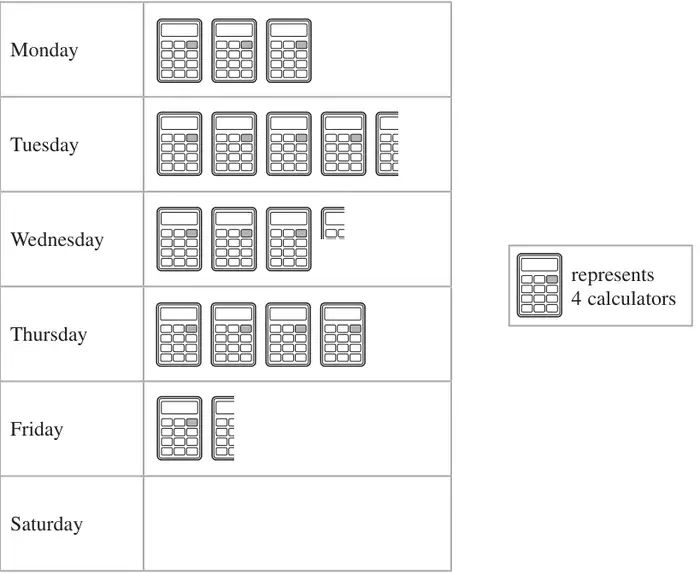
(a) How many calculators were sold on Monday? (1)
(b) How many more calculators were sold on Wednesday than were sold on Friday? (2)
(c) 15 calculators were sold on Saturday in the shop.
Show this information on the pictogram. (1)
Show this information on the pictogram. (1)
| Scheme | Marks |
|---|---|
| 12 | B1 |
| (1) |
| Scheme | Marks |
|---|---|
| 13 − 6 | M1 |
| 7 | A1 |
| (2) |
| Scheme | Marks |
|---|---|
| \(3\frac{3}{4}\) calculators | B1 |
| (1) | |
| (4 marks) |