
4MA0 Foundation January 2018 Paper 1 Q16
16 Janine has a bag of buttons.
The buttons are green or red or white or blue.
The pie chart gives information about the number of buttons of each colour in Janine’s bag.
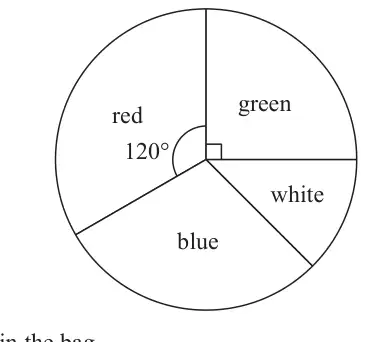
There are 60 green buttons in the bag.
(a) Work out the total number of buttons in the bag. (1)
(b) Work out the number of red buttons in the bag. (1)
Janine also has a tin of counters.
The table gives information about the counters in Janine’s tin.
| Colour | Frequency |
|---|---|
| Black | 40 |
| Pink | 30 |
| Orange | 55 |
| Purple | 75 |
| Total | 200 |
(c) Write down the fraction of the counters in Janine’s tin that are black.
Give your fraction in its simplest form. (2)
Give your fraction in its simplest form. (2)
A pie chart is drawn to show information about the number of counters of each colour in Janine’s tin.
(d) Work out the size of the angle in the pie chart for the 30 pink counters. (2)
| Scheme | Marks |
|---|---|
| 240 | B1 |
| (1) |
| Scheme | Marks |
|---|---|
| 80 | B1 |
| (1) |
| Scheme | Marks |
|---|---|
| \(\dfrac{40}{200}\) | M1 |
| \(\dfrac{1}{5}\) | A1 |
| (2) |
Notes
M1: for any correct fraction
| Scheme | Marks |
|---|---|
\(\dfrac{30}{200} \times 360\) oe or 360 ÷ 200 = 1.8 and 1.8 × 30 | M1 |
| 54 | A1 |
| (2) |
Notes
M1: for a correct method to find angle for pink buttons