
D1 June 2014 Q8
8.
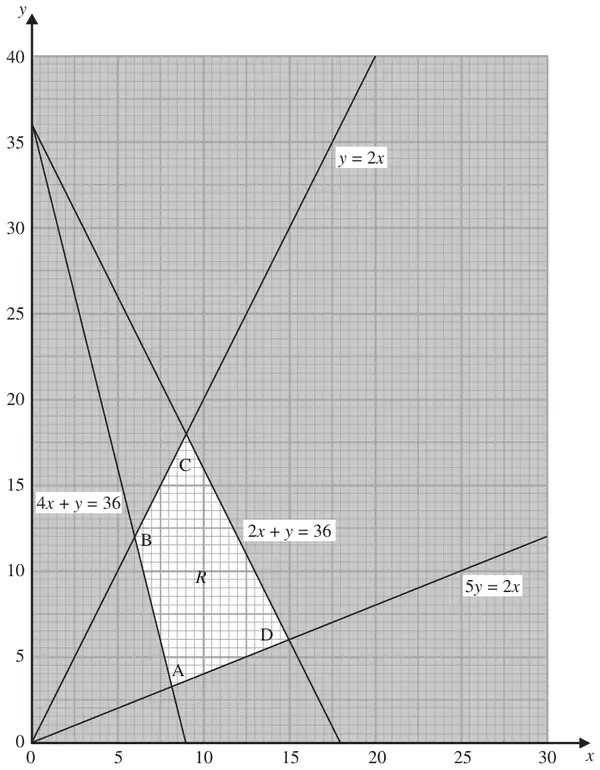
The graph in Figure 4 is being used to solve a linear programming problem. The four constraints have been drawn on the graph and the rejected regions have been shaded out. The four vertices of the feasible region \(R\) are labelled A, B, C and D.
The objective function, P, is given by
\[P = x + ky\]where \(k\) is a positive constant.
The minimum value of the function P is given by the coordinates of vertex A and the maximum value of the function P is given by the coordinates of vertex D.
| Scheme | Marks |
|---|---|
| \(y \leqslant 2x,\quad 5y \geqslant 2x,\quad 2x + y \leqslant 36,\quad 4x + y \geqslant 36\) | B2,1,0 |
| (2) |
Notes
a1B1 Any two correct inequalities (condone strict inequalities).
a2B1 CAO (equalities cannot be strict for this mark).
| Scheme | Marks |
|---|---|
| \(\mathrm{B}(6, 12),\ \ \mathrm{C}(9, 18),\ \ \mathrm{D}(15, 6)\) | B1 |
| \(\mathrm{A}\left(\dfrac{90}{11}, \dfrac{36}{11}\right)\), | B1 |
| at A: \(F = \frac{90}{11} + \frac{36}{11}k\), at B: \(F = 6 + 12k\), at C: \(F = 9 + 18k\), at D: \(F = 15 + 6k\) | B1 |
| \(\dfrac{90}{11} + \dfrac{36}{11}k \lt 6 + 12k\) and \(9 + 18k \lt 15 + 6k\) | M1 |
| \(k \gt \dfrac{1}{4}\) and \(k \lt \dfrac{1}{2}\) | A1 |
| \(\dfrac{1}{4} \lt k \lt \dfrac{1}{2}\) | A1 |
| (6) | |
| (8 marks) |
Notes
As there are a number of different methods that the candidates can adopt – consider the candidate’s full response and mark each attempt according to the notes below – award the candidate the marks for their best response/attempt. However, do not mix the approaches together e.g. if they find the exact coordinates of all four vertices and then state that the maximum gradient of P is \(-2\) then this would score the first two marks only (method 1).
Method 1 (point testing)
b1B1 The coordinates of B, C and D stated exactly.
b2B1 The coordinates of A stated exactly.
b3B1 The objective function calculated in terms of \(k\) at either A or B or C or D.
b1M1 Either (their objective function at A) < (their objective function at B) or (their objective function at C) < (their objective function at D) (condone equals sign or any inequality).
b1A1 Either \(k \gt \frac{1}{4}\) or \(k \lt \frac{1}{2}\) or \(k \geqslant \frac{1}{4}\) or \(k \leqslant \frac{1}{2}\).
b2A1 CAO \(\frac{1}{4} \lt k \lt \frac{1}{2}\) or \(\frac{1}{4} \leqslant k \leqslant \frac{1}{2}\) (or as separate inequalities)
Method 2 (objective line method I)
Comparing the gradient of the objective function to the gradient of the two lines with negative gradient.
b1B1 The minimum gradient (of P) stated as \(-4\) – must see explicit mention of minimum.
b2B1 The maximum gradient (of P) stated as \(-2\) – must see explicit mention of maximum.
b3B1 Gradient of objective function stated as \(-\frac{1}{k}\).
b1M1 Comparing gradient of objective function to either \(-2\) or \(-4\).
Final two marks as in method 1.
Method 3 (objective line method II)
b1B1 Minimum P parallel to \(4x + y = \cdots\) (limiting case) – must see explicit mention of minimum.
b2B1 Maximum P parallel to \(2x + y = \cdots\) (limiting case) – must see explicit mention of maximum.
b3B1 Re-arranging equations (either seen or implied) to give \(x + \frac{y}{4} = \cdots,\ x + \frac{y}{2} = \cdots\)
b1M1 Compare coefficients of \(y\) in the objective function & lines.
Final two marks as in method 1.
SC: If no working seen (max 3/6 marks)
\(k \blacksquare \frac{1}{2}\) or \(k \blacksquare \frac{1}{4}\) (where \(\blacksquare\) is any inequality or equals) award first B mark.
\(k \gt \frac{1}{4}\) or \(k \lt \frac{1}{2}\) or \(k \geqslant \frac{1}{4}\) or \(k \leqslant \frac{1}{2}\) award the first two B marks.
\(\frac{1}{4} \lt k \lt \frac{1}{2}\) or \(\frac{1}{4} \leqslant k \leqslant \frac{1}{2}\) award the first three B marks.