
D1 January 2007 Q7
7.
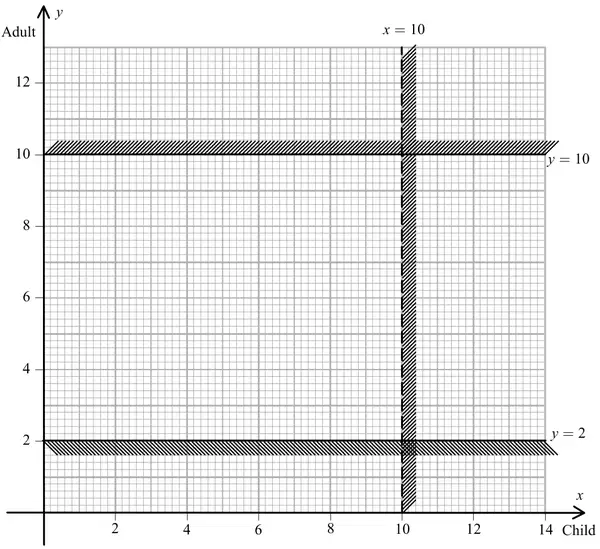
The captain of the Malde Mare takes passengers on trips across the lake in her boat.
The number of children is represented by \(x\) and the number of adults by \(y\).
Two of the constraints limiting the number of people she can take on each trip are
\[x \lt 10\]and
\[2 \leqslant y \leqslant 10\]These are shown on the graph in Figure 6, where the rejected regions are shaded out.
(a) Explain why the line \(x = 10\) is shown as a dotted line. (1)
(b) Use the constraints to write down statements that describe the number of children and the number of adults that can be taken on each trip. (3)
For each trip she charges £2 per child and £3 per adult. She must take at least £24 per trip to cover costs. The number of children must not exceed twice the number of adults.
(c) Use this information to write down two inequalities. (2)
(d) Add two lines and shading to Diagram 1 in your answer book to represent these inequalities. Hence determine the feasible region and label it R. (4)
(e) Use your graph to determine how many children and adults would be on the trip if the captain takes:
(i) the minimum number of passengers,
(ii) the maximum number of passengers. (4)
| Scheme | Marks |
|---|---|
| To show a strict inequality | B1 |
| (1) |
| Scheme | Marks |
|---|---|
| There must be fewer than 10 children | B1 |
| There must be between 2 and 10 adults, inclusive. | B2,1,0 |
| (3) |
| Scheme | Marks |
|---|---|
| \(2x + 3y \geqslant 24\) | B1 |
| \(x \leqslant 2y\) | B1 |
| (2) |
| Scheme | Marks |
|---|---|
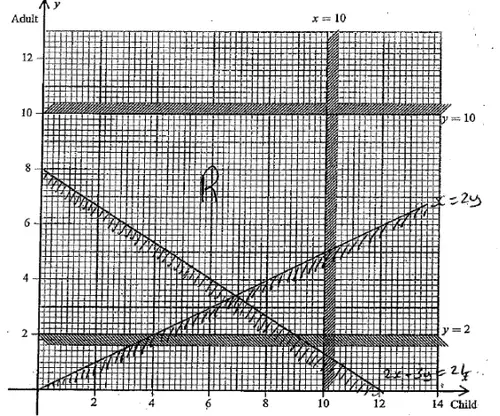 | B1ft \((2x + 3y = 24)\) B1ft \((x = 2y)\) B1ft (shading) B1 (R) |
| (4) |
| Scheme | Marks |
|---|---|
| minimum 0 children 8 Adults – 8 passengers | M1 A1 |
| maximum 9 children 10 Adults – 19 passengers | B1 B1 |
| (4) | |
| (14 marks) |