
Higher June 2019 Paper 1 Q2
2 Jalina left her home at 10 00 to cycle to a park.
On her way to the park, she stopped at a friend’s house and then continued her journey to the park.
Here is the distance-time graph for her journey to the park.
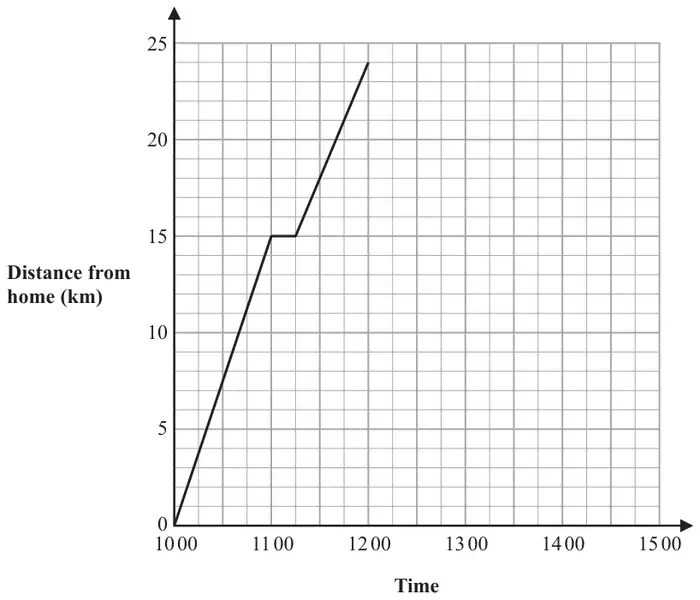
Give a reason for your answer. (1)
Jalina stayed at the park for 45 minutes.
She then cycled, without stopping, at a constant speed of 16 km/h from the park back to her home.
Do not include the times when she was not cycling in your calculation.
Give your answer correct to 1 decimal place. (3)
| Scheme | Marks |
|---|---|
15 km/h or \(\dfrac{25}{6}\) m/sec or 0.25 km/min or \(\dfrac{15}{4}\) oe 12 km/h or \(\dfrac{10}{3}\) m/sec or 0.2 km/min or \(\dfrac{9}{3}\) oe Answer: ‘before’ with reason | B1 |
| (1) |
Notes
B1: e.g. before as gradient is steeper or before as speed before is 15 km/h speed after is 12 km/h or before as she goes over 11(allow 11-12) km in ¾ hour but only goes 9 km in ¾ hour after oe
NB: any figures used for the reason must be accurate if they haven’t used ‘gradient is steeper’ oe
| Scheme | Marks |
|---|---|
| line from (12:00, 24) to (12:45, 24) to (14:15, 0) | B2 |
| (2) |
Notes
B2: If not B2 then B1 for a line from (12:00, 24) to (12:45, 24) or for a line from (\(t\), 24) to (\(t\) + 1.5, 0) or for a time of 1.5 hours (oe) seen
| Scheme | Marks |
|---|---|
| 1h 45m + 1h 30m or 1 + 0.75 + 1.5 or 3h 15m or 3.25h or 195m oe | M1 |
| (24 × 2) ÷ “3.25” oe eg (48 ÷ 195) × 60 | M1 |
| 14.8 | A1 |
| (3) | |
| (6 marks) |
Notes
M1: ft from their graph for total time when cycling
M1: ft dep on M1 for full method
A1: awrt 14.8