
Higher January 2022 Paper 2 Q20
20 The histogram gives information about the heights, \(h\) cm, of some tomato plants.
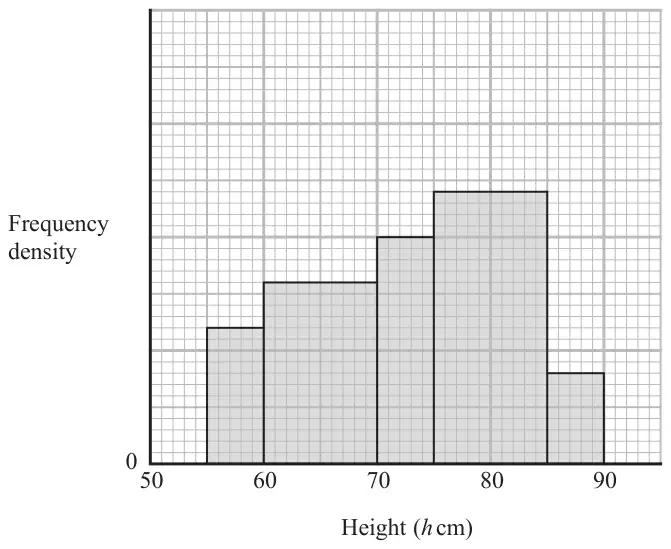
There are 12 tomato plants for which \(75 \lt h \leqslant 85\)
One of the tomato plants is selected at random.
Find an estimate for the probability that this tomato plant has a height greater than 82.5 cm
(4)
| Scheme | Marks |
|---|---|
| at least two of 3, 8, 5, 2 seen or at least two correct frequency densities from 0.6, 0.8, 1, 1.2, 0.4 or eg one cm on FD axis = 0.25 or eg top of FD axis labelled 2 or eg 1 plant = 20 small squares or total small squares in at least 2 bars (60, 160, 100, 240, 40) or total number of 1 cm squares for at least 2 bars (2.4, 6.4, 4, 9.6, 1.6) oe | M1 |
| 3 + 8 + 5 + 12 + 2 (= 30) or adding the number of small squares in all bars: 60 + 160 + 100 + 240 + 40 (= 600) or adding the number of 1 cm squares in all bars: 2.4 + 6.4 + 4 + 9.6 + 1.6 (= 24) oe | M1 |
| \(\dfrac{0.25 \times \text{``}{12}\text{''} + \text{``}{2}\text{''}}{\text{``}{30}\text{''}}\) or \(\dfrac{0.25 \times \text{``}{240}\text{''} + \text{``}{40}\text{''}}{\text{``}{600}\text{''}}\) or \(\dfrac{0.25 \times \text{``}{9.6}\text{''} + 1.6}{\text{``}{24}\text{''}}\) oe | M1 |
| \(\dfrac{1}{6}\) | A1 |
| (4) | |
| (4 marks) |
Notes
M1: At least 2 frequencies for other bars
or scale on FD axis
or eg 20 small squares represents 1 plant oe
M1: add up 5 frequencies (allow one error)
or
adding the number of small squares in all bars
(allow one error)
or
adding the number of 1 cm squares in all bars (allow one error)
oe
M1: ft their figures dep on the previous M1
A1: oe eg \(\dfrac{100}{600}\)
allow 0.16(66…) ie 2 dp truncated or rounded or better