
May 2022 Paper 1 Q8
8. Part of the graph of \(y=a\sin bx^\circ\) is shown in the diagram.
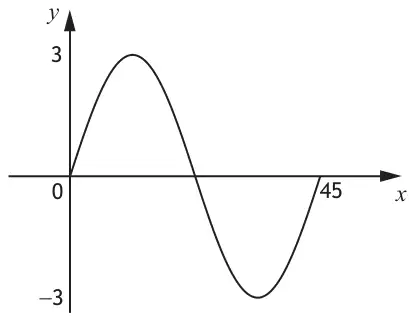
(a) State the value of \(a\). [1]
(b) State the value of \(b\). [1]
| Mark | Generic scheme | Illustrative scheme |
|---|---|---|
| •1 | state the value of \(a\) | 3 |
| (1) |
| Mark | Generic scheme | Illustrative scheme |
|---|---|---|
| •2 | state the value of \(b\) | 8 |
| (1) |
Notes:
- For \((y{=})\,3\sin8x\) award 1/1 for (a) and 1/1 for (b)
- For answers of \(a=8\) and \(b=3\) or \((y{=})\,8\sin3x\) award 0/1 ✗ for (a) and 1/1✓1 for (b)