
4MA0 Foundation June 2012 Paper 1 Q2
2 The bar chart shows information about the number of people in the world who had swine flu on each of the first 5 days of May 2009.
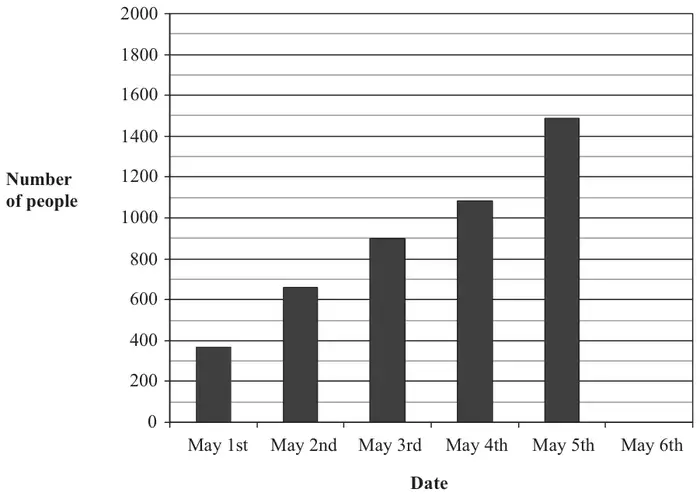
(a) How many people had swine flu on May 3rd? (1)
(b) On which date did 658 people have swine flu? (1)
(c) On May 6th, 1893 people had swine flu.
Draw a bar on the bar chart to show this information. (1)
Draw a bar on the bar chart to show this information. (1)
On May 9th, 3440 people had swine flu.
(d) 7% of these 3440 people were in Canada.
Work out 7% of 3440 (2)
Work out 7% of 3440 (2)
(e) 1639 of these 3440 people were in the USA.
Express 1639 as a percentage of 3440
Give your answer correct to 1 decimal place. (2)
Express 1639 as a percentage of 3440
Give your answer correct to 1 decimal place. (2)
| Scheme | Marks |
|---|---|
| 900 | B1 |
| (1) |
Notes
B1: cao
| Scheme | Marks |
|---|---|
| 2nd | B1 |
| (1) |
Notes
B1: Accept any clear indication
| Scheme | Marks |
|---|---|
| 1800 < bar < 1900 | B1 |
| (1) |
Notes
B1: Accept 1900 but not 1800
| Scheme | Marks |
|---|---|
| eg \(\dfrac{7}{100} \times 3440\) | M1 |
| 240.8 or 241 | A1 |
| (2) |
Notes
A1: Also accept 240
| Scheme | Marks |
|---|---|
| \(\dfrac{1639}{3440} \times 100\) | M1 |
| 47.6 | A1 |
| (2) | |
| (Total 7 marks) |
Notes
M1: for \(\dfrac{1639}{3440}\) (0.47645…)
A1: for ans rounding to 47.6