
4MA0 Foundation January 2013 Paper 1 Q2
2 The bar chart shows the percentage of the world’s oil used by each of five regions in 2009.
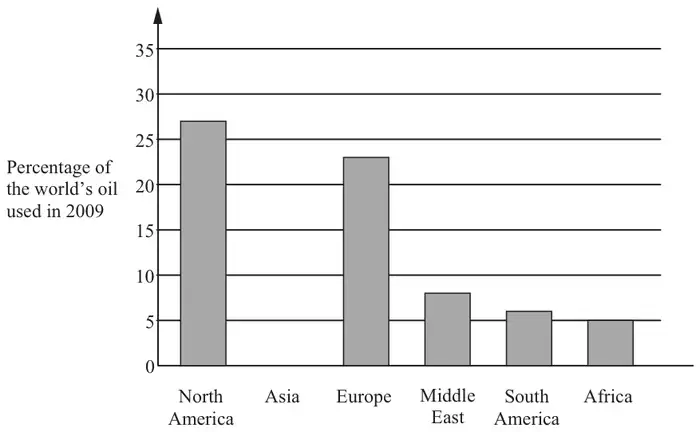
(a) Write down the percentage of the world’s oil used by Africa. (1)
(b) Write down the percentage of the world’s oil used by North America. (1)
(c)
(i) Write down the name of the region which used 8% of the world’s oil.
(ii) Change 8% to a fraction.
Give your fraction in its simplest form.
(3)Give your fraction in its simplest form.
In 2009, the percentage of the world’s oil used by Asia was 31%.
(d) Draw a bar on the bar chart to show this information. (1)
| Scheme | Marks |
|---|---|
| 5 | B1 |
| (1) |
| Scheme | Marks |
|---|---|
| 26 to 28 inclusive | B1 |
| (1) |
Notes
B1: accept decimal values between 26 and 28
| Scheme | Marks |
|---|---|
| (i) Middle East | B1 |
| (ii) \(\dfrac{2}{25}\) | B2 |
| (3) |
Notes
B2: B1 for \(\dfrac{8}{100}\) or \(\dfrac{4}{50}\)
| Scheme | Marks |
|---|---|
| Bar drawn \(\gt 30\) and \(\lt 35\) | B1 |
| (1) |
Notes
B1: Bar drawn between (not touching) heights 30 and 35