
4MA0 Foundation June 2013 Paper 1R Q3
3 The bar chart shows information about how some students travelled to school one day.
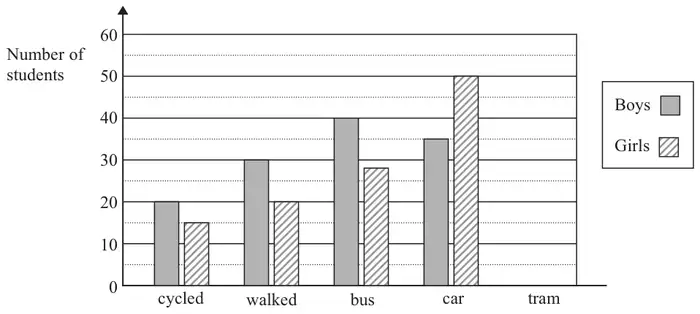
(a) Write down the number of boys who walked. (1)
(b) Write down the number of girls who travelled by bus. (1)
(c) 25 boys and 10 girls travelled by tram.
Show this information on the bar chart. (1)
Show this information on the bar chart. (1)
(d) Find the ratio of the number of boys who cycled to the number of girls who cycled.
Give your ratio in its simplest form. (2)
Give your ratio in its simplest form. (2)
| Scheme | Marks |
|---|---|
| 30 | B1 |
| (1) |
| Scheme | Marks |
|---|---|
| 28 | B1 |
| (1) |
Notes
B1: accept \(26 \lt \text{ans} \lt 30\)
| Scheme | Marks |
|---|---|
| Boys bar = 25, Girls bar = 10 | B1 |
| (1) |
Notes
B1: Both bars correct.
| Scheme | Marks |
|---|---|
| 20:15 | M1 |
| 4:3 | A1 |
| (2) |
Notes
A1: SC B1 for 3:4 if or 1:(0).75 if M0 scored