
4MA0 Foundation January 2016 Paper 1R Q4
4 The table shows the number of goals scored for a football team by each of four players during part of a football season.
| Player | Goals scored |
|---|---|
| Ben | 20 |
| Dale | 15 |
| Matt | 5 |
| Ronald | 35 |
(a) On the grid, draw a bar chart to show this information.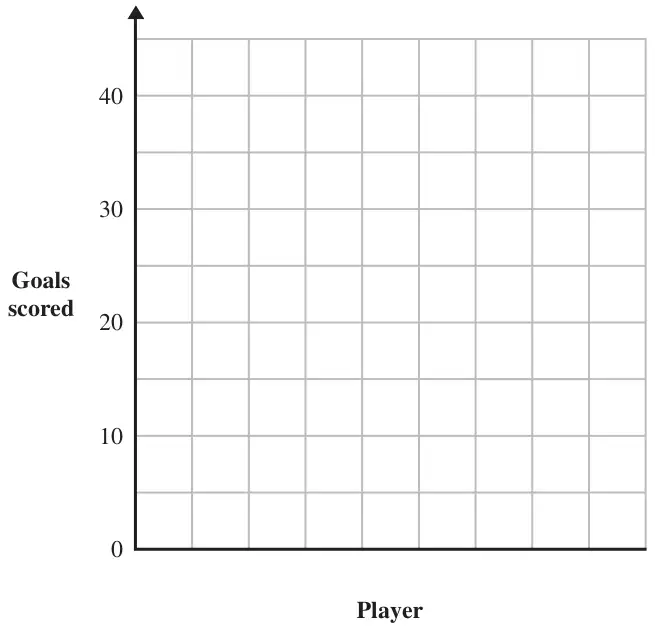
(b) Work out the mean of the numbers of goals scored by these players. (2)
(c) Work out the range of the numbers of goals scored by these players. (2)
(d) Write down the ratio of the number of goals scored by Ronald to the number of goals scored by Dale.
Give your answer in its simplest form. (2)
Give your answer in its simplest form. (2)
| Scheme | Marks |
|---|---|
| M1 | |
| M1 | |
| Correct bar chart | A1 |
| (3) |
Notes
M1: At least three vertical bars, joined or separated, with at least one correct.
M1: Four vertical bars, joined or separated, with at least two correct.
A1: Four correctly labelled bars of the correct height.
| Scheme | Marks |
|---|---|
| (20 + 15 + 5 + 35)/4 | M1 |
| 18.75 | A1 |
| (2) |
Notes
A1: Allow 19; allow 18 if M1 awarded.
SCB1 for 48.75
| Scheme | Marks |
|---|---|
| \(35 - 5\) | M1 |
| 30 | A1 |
| (2) |
Notes
M1: Allow \(8 - 35\) or 8 to 35
| Scheme | Marks |
|---|---|
| 35 : 15 | M1 |
| 7 : 3 | A1 |
| (2) | |
| Total 9 marks |
Notes
A1: SCB1 for 3:7