
4MA0 Foundation June 2014 Paper 2 Q14
14 The pie chart shows information about the types of vehicles that went past a school, in one hour, on Monday morning.
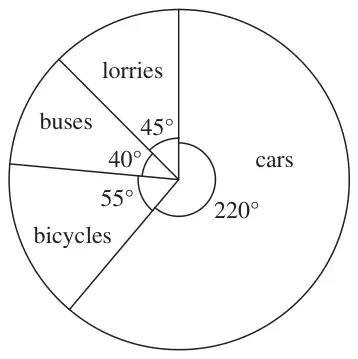
(a) 16 buses went past the school.
Work out the number of bicycles that went past the school. (2)
Work out the number of bicycles that went past the school. (2)
(b) The table shows the numbers of vehicles that went past the school, in one hour, on Tuesday morning.
A pie chart is to be drawn to show this information.
Work out the size of the angle in the pie chart for the 9 lorries. (2)
| Vehicles | Frequency |
|---|---|
| Cars | 41 |
| Bicycles | 15 |
| Buses | 7 |
| Lorries | 9 |
| Total | 72 |
Work out the size of the angle in the pie chart for the 9 lorries. (2)
| Scheme | Marks |
|---|---|
| 40/16 or 16/40 40/55 or 55/40 | M1 |
| 22 | A1 |
| (2) |
| Scheme | Marks |
|---|---|
| \(\dfrac{9}{72} \times 360\) | M1 |
| 45 | A1 |
| (2) | |
| (4 marks) |
Notes
M1: for 9/72 or 72/9 or 360/72(=5)