
4MA0 Foundation January 2015 Paper 2 Q4
4 The bar chart shows information about the number of barrels of oil produced per day in each of five countries.
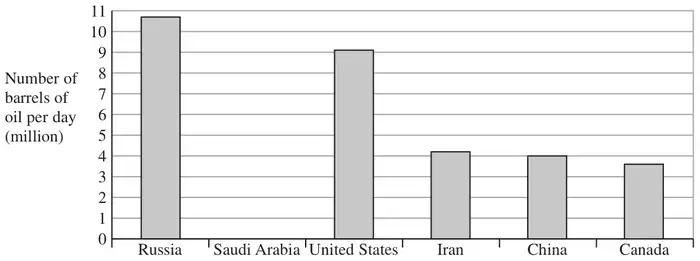
(a) Write down the number of barrels of oil produced per day in China. (1)
(b) Write down the number of barrels of oil produced per day in Russia. (1)
(c) Which country produces 4.2 million barrels of oil per day? (1)
Saudi Arabia produces 9.6 million barrels of oil per day.
(d) Draw a bar on the bar chart to show this information. (1)
In the United States
72 000 barrels of oil are produced per day in the state of Utah.
18 000 barrels of oil are produced per day in the state of Michigan.
(e) Find the ratio of the number of barrels of oil produced in Utah to the number of barrels of oil produced in Michigan.
Give your ratio in its simplest form. (2)
Give your ratio in its simplest form. (2)
| Scheme | Marks |
|---|---|
| 4 | B1 |
| (1) |
| Scheme | Marks |
|---|---|
| 10.8 | B1 |
| (1) |
Notes
B1: accept 10.5 - 11 exclusive
| Scheme | Marks |
|---|---|
| Iran | B1 |
| (1) |
| Scheme | Marks |
|---|---|
| bar drawn | B1 |
| (1) |
Notes
B1: bar drawn (accept any width) with 9.5 < height < 10
| Scheme | Marks |
|---|---|
| 72 000 : 18 000 | M1 |
| 4 : 1 | A1 |
| (2) | |
| (6 marks) |
Notes
M1: or any equivalent ratio eg 72 : 18
A1: SC : B1 for an answer of 1 : 4