
4MA0 Foundation January 2017 Paper 1 Q3
3 Calvin asked some teachers how many children they have.
The table shows information about his results.
| Number of children | 0 | 1 | 2 | 3 |
|---|---|---|---|---|
| Number of teachers | 8 | 24 | 16 | 10 |
Calvin started to draw a pictogram for the information in the table.
He showed the information for teachers with 0 and 1 child.
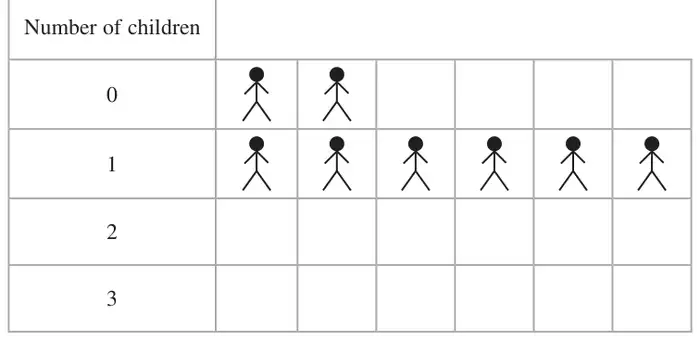
(a) How many teachers does  represent? (1)
represent? (1)(b) Complete the pictogram for the information in the table. (2)
(c) Find the total number of teachers Calvin asked. (1)
(d) Find the ratio of the number of teachers with 1 child to the number of teachers with 2 children.
Give your ratio in its simplest form. (2)
Give your ratio in its simplest form. (2)
| Scheme | Marks |
|---|---|
| 4 | B1 |
| (1) |
| Scheme | Marks |
|---|---|
| B1ft | |
| correct pictogram | B1ft |
| (2) |
Notes
B1ft: 4 ‘men’ for 2 children,
B1ft: 2.5 ‘men’ for 3 children.
| Scheme | Marks |
|---|---|
| 58 | B1 |
| (1) |
| Scheme | Marks |
|---|---|
| M1 | |
| 3:2 | A1 |
| (2) | |
| (6 marks) |
Notes
M1: 24:16 or equivalent but not 3:2 or 2 : 3
A1: accept 1.5 : 1 or 1 : \(\dfrac{2}{3}\)