
4MA0 Foundation January 2014 Paper 2 Q10
10 The pie chart shows information about the use of water by people in a village in Zambia on one day.
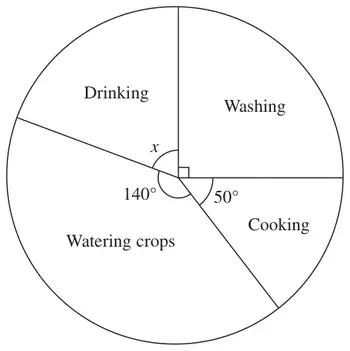
Diagram NOT accurately drawn
(a)
(i) Calculate the size of angle \(x\).
(ii) Explain how you found your answer.
(2)(b) 90 litres of water were used for cooking.
How many litres were used for watering crops? (3)
How many litres were used for watering crops? (3)
| Scheme | Marks |
|---|---|
| (i) Answer: 80 | B1 |
| (ii) Answer: angles at a point = 360 degrees | B1 |
| (2) |
Notes
B1: (indep) Accept “angles at a centre = 360 degrees”.
“angles in a complete / full turn = 360 degrees”.
“angles in one revolution = 360 degrees”.
“angles in a pie chart = 360 degrees”
any numerical explanation involving 360
| Scheme | Marks |
|---|---|
| 140 / 50 × 90 oe | M2 |
| 252 | A1 |
| (3) | |
| (Total 5 marks) |
Notes
M2: i.e. one complete full correct method.
If not M2 then M1 for 140 ÷ 50 (= 2.8) or 50 ÷ 140 (= 0.357..) or 90 ÷ 50 (= 1.8) or 50 ÷ 90 (= 0.55....)
A1: cao