
4MA0 Foundation January 2014 Paper 2 Q9
9 Usain runs in a race.
The graph shows his speed, in metres per second (m/s), during the first 10 seconds of the race.
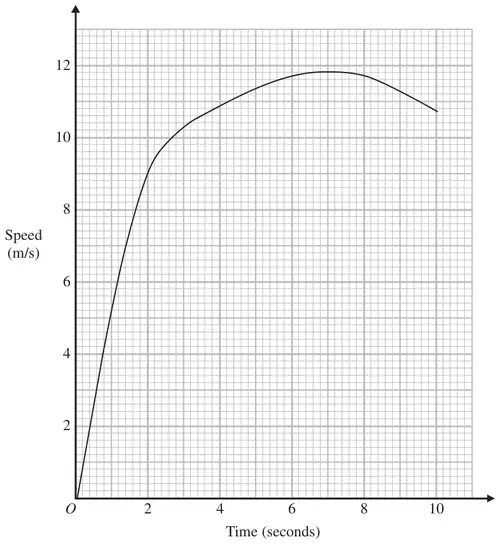
(a) Write down Usain’s speed at 2 seconds. (1)
(b) Write down Usain’s greatest speed. (1)
(c) Write down the time at which Usain’s speed was 7 m/s. (1)
| Scheme | Marks |
|---|---|
| 9 to 9.1 | B1 |
| (1) |
| Scheme | Marks |
|---|---|
| 11.8 | B1 |
| (1) |
| Scheme | Marks |
|---|---|
| 1.4 | B1 |
| (1) | |
| (Total 3 marks) |