
4MA0 Foundation January 2014 Paper 2 Q4
4 The pictogram shows information about the number of people who visited a cafe on each of six days.
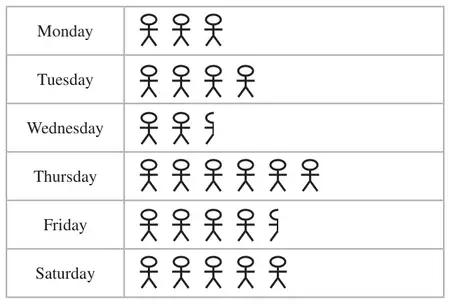
(a) On which day did the greatest number of people visit the cafe? (1)
On Monday, 60 people visited the cafe.
(b)
(i) How many people does  represent?
represent?(ii) Find the number of people who visited the cafe on Tuesday.
(iii) Find the number of people who visited the cafe on Friday.
(3)On Saturday, 65% of people who visited the cafe were female.
(c) What percentage of people who visited the cafe on Saturday were not female? (1)
(d) Write 65% as a fraction.
Give your answer in its simplest form. (2)
Give your answer in its simplest form. (2)
| Scheme | Marks |
|---|---|
| Thursday | B1 |
| (1) |
| Scheme | Marks |
|---|---|
| (i) Answer: 20 | B1 |
| (ii) Answer: 80 | B1 |
| (iii) Answer: 90 | B1 |
| (3) |
Notes
B1: Positive integers only.
B1: ft from (b) (i) i.e 4 × “20”
Positive integers only.
B1: ft from (b) (i) i.e 4.5 × “20” Positive integers only.
| Scheme | Marks |
|---|---|
| 35 | B1 |
| (1) |
| Scheme | Marks |
|---|---|
| \(\dfrac{65}{100}\) | M1 |
| \(\dfrac{13}{20}\) | A1 |
| (2) | |
| (Total 7 marks) |
Notes
M1: oe