
4MA0 Foundation June 2016 Paper 1R Q1
1 The pictogram gives information about the number of laptops sold from a shop for each of the first 3 weeks in April.
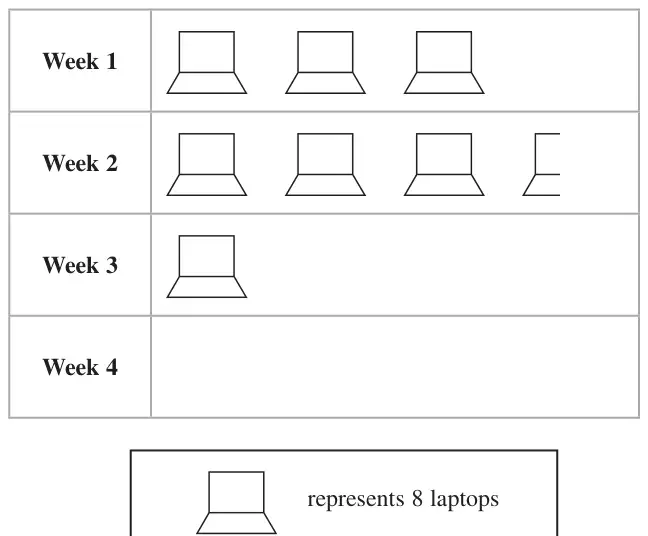
(a) Write down the number of laptops sold from the shop in Week 1 (1)
The shop sold 32 laptops in Week 4
(b) Show this information on the pictogram. (1)
(c) Work out the total number of laptops sold from the shop during the 4 weeks. (2)
| Scheme | Marks |
|---|---|
| 24 | B1 |
| (1) |
| Scheme | Marks |
|---|---|
| 4 icons shown | B1 |
| (1) |
| Scheme | Marks |
|---|---|
| M1 | |
| 92 | A1 |
| (2) |
Notes
M1: ‘24’ + 28 + 8 + 32 or 11.5 × 8 oe